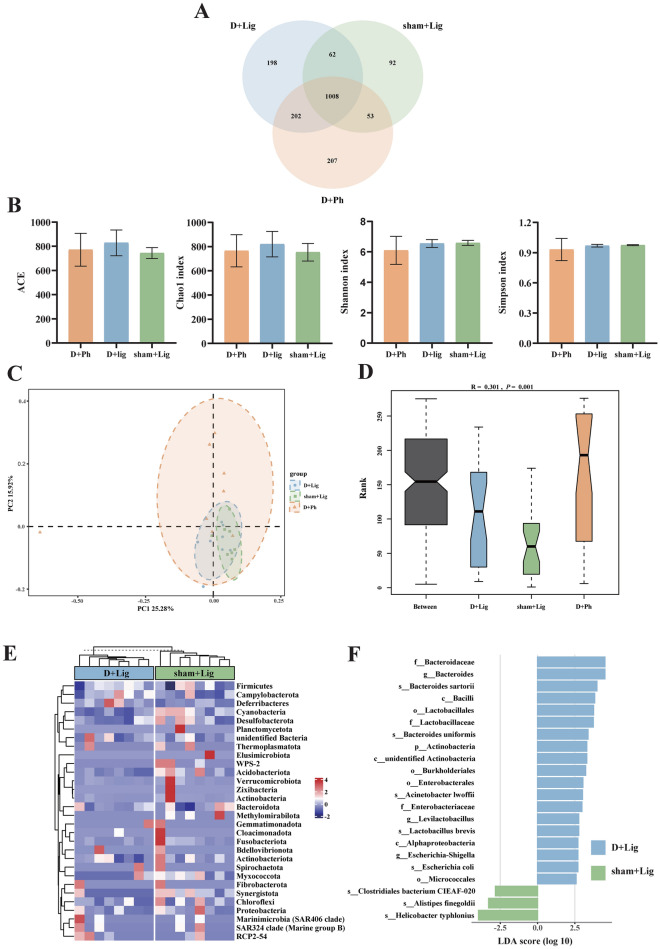
Fig. 4.
D-gal-induced aging alters gut microbiota composition and structure in periodontitis mice (n = 8/group). (A) Veen diagram of operational taxonomic units (OTUs) among D + Ph, D + Lig and sham + Lig groups, (B) Alpha diversity -ACE, Chao1, Shannon and Simpson indices among D + Ph, D + Lig and sham + Lig groups, (C) Gut microbiota profiles were examined by principal coordinate analysis (PCoA) based on bray curtis distance among D + Ph, D + Lig and sham + Lig groups, (D) Analysis of similarities (ANOSIM) analysis was used to compare the composition of gut microbiota among D + Ph, D + Lig and sham + Lig groups. R > 0 indicates the difference of inter-group is greater than inner-group. The reliability of the statistical analysis was expressed as a p-value, (E) Heatmap of the gut microbiota at phylum level with relative abundance at top 30 in D + Lig and sham + Lig groups, (F) Linear discriminant analysis effect size (LEfSe) analysis showing the biomarkers of D + Lig and sham + Lig groups. Taxa with an linear discriminant analysis (LDA) score > 2.5 are shown. Bar graphs presented as mean ± standard deviation (SD). ANOSIM, analysis of similarities; LDA, linear discriminant analysis; LEfSe, linear discriminant analysis effect size; OTUs, operational taxonomic units; PCoA, principal coordinate analysis; SD, standard deviation.

