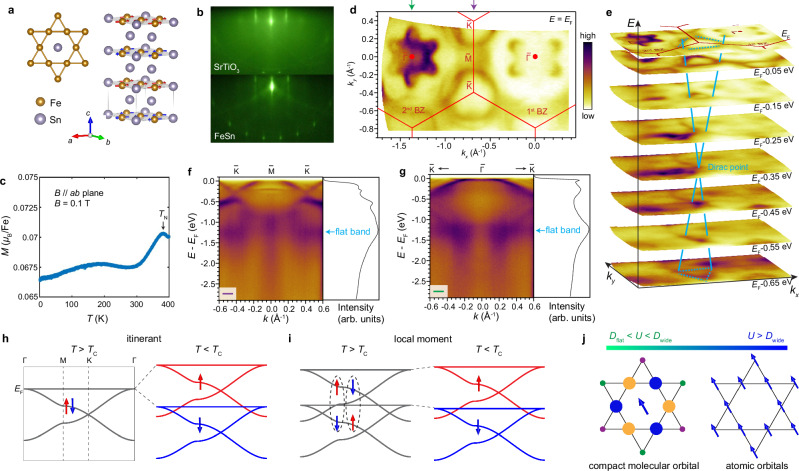
Fig. 1. Basic characterizations of the FeSn film.
a Schematic of the crystal and magnetic structure of FeSn. Brown and blue spheres denote the Fe and Sn atoms, respectively. b RHEED image of SrTiO3(111) and the FeSn film. c Magnetization as a function of temperature taken with a magnetic field of 0.1 T applied parallel to the ab-plane. d FS map taken at 45 K overlaid with the BZ boundaries. Green and purple arrows indicate the cuts shown in (f, g). e Constant energy contours for the same k-space region as in (d). Blue solid and dashed lines denote the Dirac dispersions. f, g and cuts taken at 83 K and their momentum-integrated EDCs. h Schematic of the kagome band splitting across TC driven by the itinerant flat band magnetism. Red and blue arrows denote the opposite spins. i Schematic of persistent band splitting and diminishing spin polarization above TC in the local moment scenario. Dashed lines indicate two degenerate cases of exchange splitting for spin up and spin down local moments. j Schematics of the compact molecular orbital and atomic orbitals and their local moments in different regimes of U. Size and color of the filled circles indicate the amplitude and phase of the Wannier function35.

