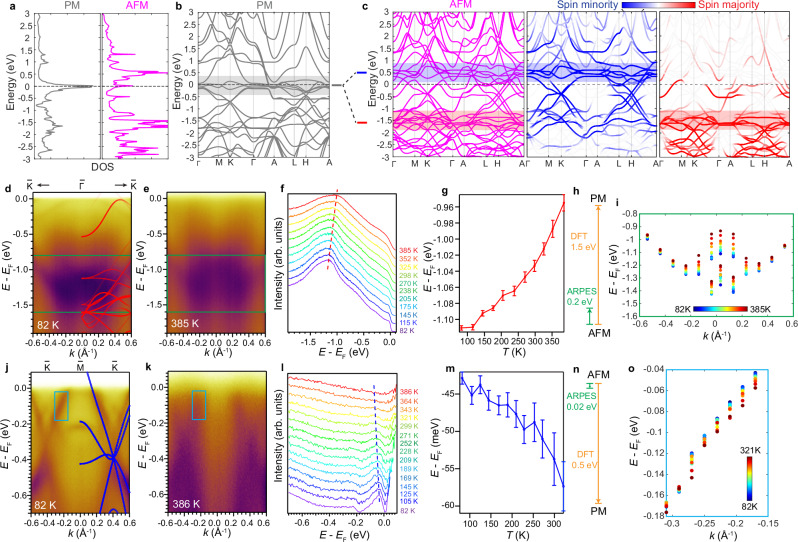
Fig. 2. Persistent exchange splitting above TN.
a Calculated DOS distribution for the PM and AFM phases. b-c DFT calculations in the PM phase (grey) and the AFM phase (magenta), with the spin majority (red) and spin minority (blue) bands projected for each kagome layer. Grey, blue and red shaded areas denote the flat band regions in the PM, spin minority and spin majority bands, respectively. d, e cuts taken at 82 K and 385 K. Spin majority-projected DFT calculations are superimposed on the cut in (d). f EDCs as a function of temperature taken from the cut at . Red dashed line is a guide to the eye for the shift of the two peaks in the fitting (Supplementary Fig. 3). g Energy of the fitted peak closer to EF in (f) as a function of temperature (see details of the fitting in Supplementary Fig. 3). Error bars are from the standard deviation resulting from the fitting process. h Schematic that shows the ratio of observed peak shift in (g) and the calculated band shift from PM to AFM phase in DFT. i Observation of the momentum-dependent band shifts as a function of temperature in the region enclosed in the green box in (d). At each selected momentum the temperature-dependent EDCs are fitted as shown in Supplementary Fig. 3, and the peaks are plotted here as the colored dots. j–o Data and analysis for the cut corresponding to each panel in (d–i). Spin minority-projected DFT bands are superimposed in (j). l, m are extracted from the cuts at k = −0.17 Å−1. See Supplementary Fig. 4 for the details of fitting.

