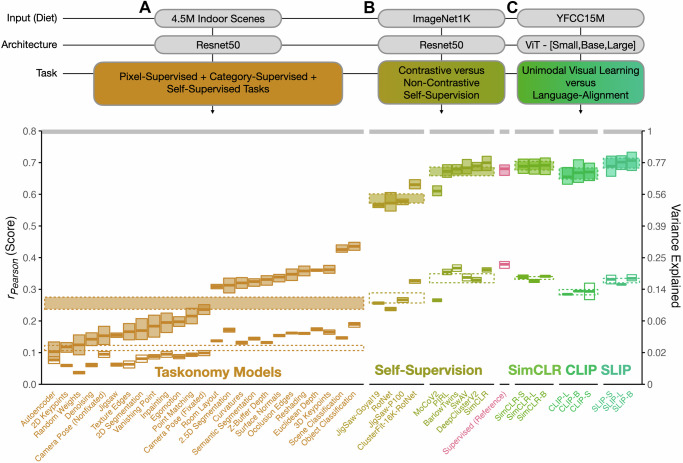
Fig. 3. Task variation.
Degree of brain predictivity (rPearson) is plotted for the sets of models with controlled variation in task. A The first set of models shows scores across the ResNet50 encoders from Taskonomy, trained on a custom dataset of 4.5 million indoor scenes. B The second set of models shows the difference between contrastive and non-contrastive self-supervised learning ResNet50 models (with a category-supervised ResNet50 for reference), trained on ImageNet1K. C The third set of models shows the scores across the vision-only and vision-language contrastive learning ViT-[Small,Base,Large] models from FaceBook’s SLIP Project, trained on the images (or image-text pairs) of YFCC15M. Each small box corresponds an individual model. In all subplots, the horizontal midline of each box indicates the mean score of each model’s most brain-predictive layer (selected by cross-validation) across the 4 subjects, with the height of the box indicating the grand-mean-centered 95% bootstrapped confidence intervals (CIs) of the model’s score across subjects. The cRSA score is plotted in open boxes, and the veRSA score is plotted in filled boxes. The class mean for each distinct set of models is plotted in striped horizontal ribbons across the individual models. The width of this ribbon reflects the 95% grand-mean-centered bootstrapped 95% CIs over the mean score for all models in this set. The noise ceiling of the occipitotemporal brain data is plotted in the gray horizontal ribbon at the top of the plot, and reflects the mean of the noise ceilings computed for each individual subject. The secondary y-axis shows explainable variance explained (the squared model score, divided by the squared noise ceiling). Source data are provided as a Source Data file.

