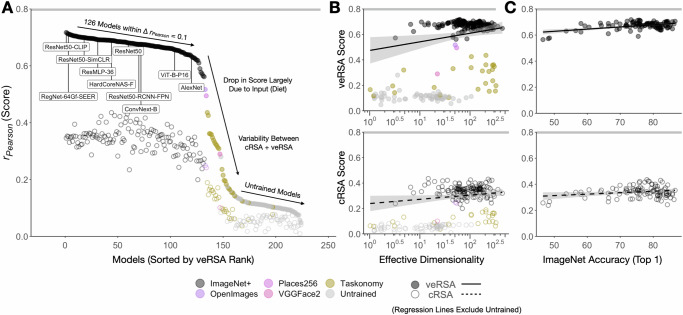
Fig. 5. Overall Model Variation.
A Brain predictivity is plotted for all models in this survey (N = 224), sorted by veRSA score. Each point is the score from the most brain-predictive layer (selected by cross-validation) of a single model, plotted for both cRSA (open) and veRSA (filled) metrics. Models trained on different image sets are labeled in color. B Brain predictivity is plotted as a function of the effective dimensionality of the most predictive layer, with veRSA scores in the top panel and cRSA scores in the bottom panel. The regression (± 95% CIs) line is fit only on trained variants of the models (excluding untrained variants). C Brain predictivity is plotted as a function of the top-1 ImageNet1K-categorization accuracy for the models (N = 108) whose metadata includes this measure (veRSA, top panel; cRSA bottom panel). The noise ceiling of the OTC brain data is shown as the gray horizontal bar at the top of each plot. Source data are provided as a Source Data file.

