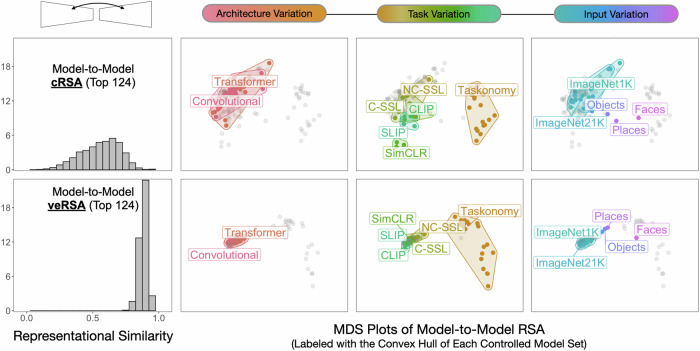
Fig. 6. Model-to-Model comparison.
Leftmost Panel: Histogram of the pairwise model-to-model representational similarity for the 124 highest-ranking trained models in our survey. The top panel indicates direct layer-to-layer comparisons, while the bottom panel reflects the feature-reweighted layer-to-layer comparisons. Rightward Panels: Results of a multidimensional scaling (MDS) analysis of the model-to-model comparisons, where models whose most brain-predictive layers (selected by cross-validation) share greater representational structure appear in closer proximity. The 3 plots in each row show datapoints output from the same MDS procedure (cRSA, top row; veRSA, bottom row), and the columns show different colored convex hulls that highlight the different model sets from the opportunistic experiments. Note the scale of the MDS plots is the same across all panels. NC-SSL and C-SSL correspond to Non-Contrastive and Contrastive Self-Supervised Learning, respectively. Objects, Faces, and Places correspond to the IPCL models trained on ImageNet1K / OpenImages, Places256, and VGGFace2, respectively. Source data are provided as a Source Data file.

