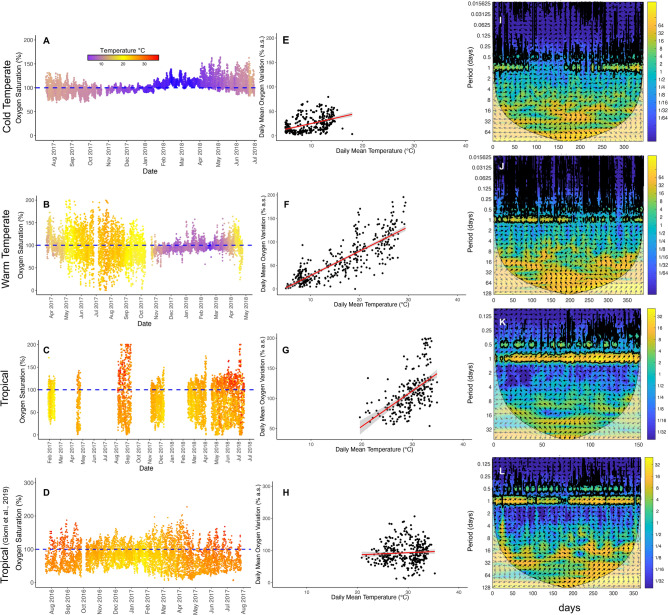
Fig. 1.
(A–D) Seawater oxygen saturation and temperature in the Cold Temperate, Warm Temperate and Tropical coastal sites (see Supplementary figure S4 for details on temperature variations). (E–H) Increase of the daily mean oxygen variation in function of the daily mean temperature calculated on the detrended time series; the red line indicates the trend of such correlations where the shaded area represents the 95% interval of confidence; %a.s. = air saturation. (I–L) Cross-wavelet analysis showing the relationship between oxygen and temperature in the three study sites. The horizontal axis represents time, while the vertical axis represents the periodicity of the corresponding oscillation. The paler area is the cone of influence, where results should not be interpreted due to biases connected to edge effects, and the thick black contour is the 5% significance level. The colour scale indicates the power of the cross-wavelet. Arrows represent the relative phase of the time series (pointing left when the two time series are in antiphase, right when in-phase). For the tropical site, the data set from Giomi et al., 20196 is also included (D,H,L).

