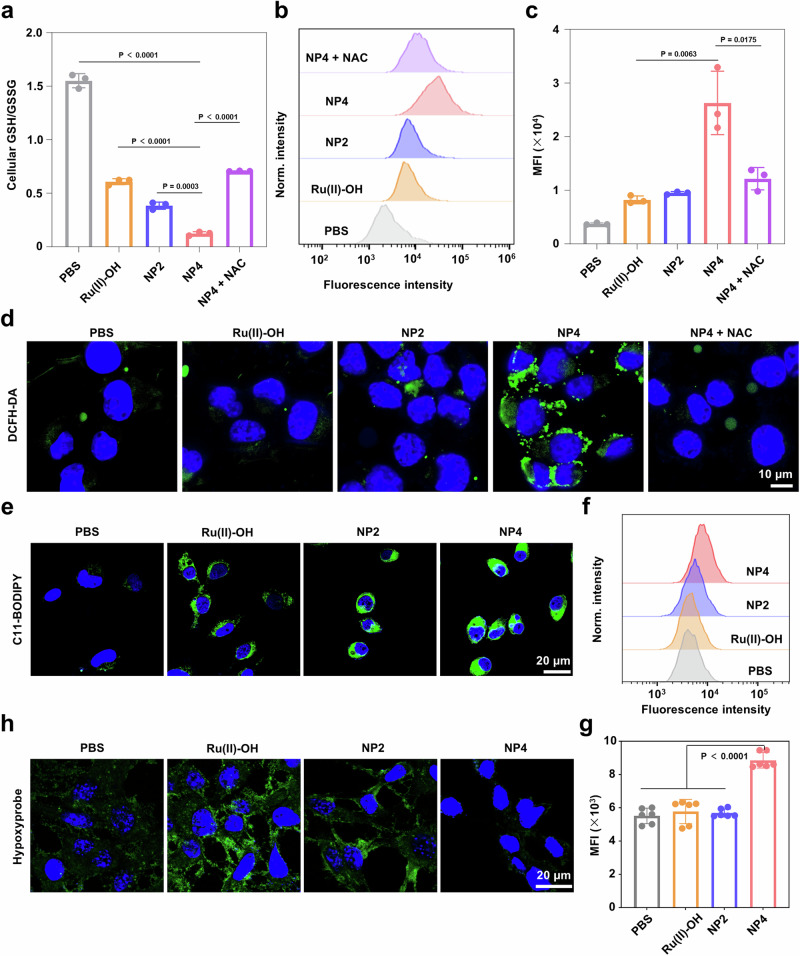
Fig. 5. Consumption of O2, accumulation of ROS, conversion of GSH, and accumulation of lipid peroxides in 143B cells under 1% O2 conditions upon treatment with Ru(II)-OH, NP2, NP4 or combined NP4 with N-acetylcysteine (NP4 + NAC).
a GSH/GSSG ratio inside the cancer cells upon various treatments, n = 3 independent experiments. b Flow cytometry plots of 143B cells in a 1% O2 atmosphere treated with Ru(II)-OH, NP2, NP4, and NP4 + NAC (10 μM Ru) for 6 h and stained with 2’,7’-dichlorodihydrofluorescein diacetate (DAFH-DA). c Quantification from (b), n = 3 independent experiments. d Representative CLSM images of 143B cells in a 1% O2 atmosphere treated with of Ru(II)-OH, NP2, NP4, and NP4 + NAC (10 μM Ru) for 6 h and stained with the ROS probe 2’,7’-dichlorodihydrofluorescein diacetate (DCFH-DA, green) and DAPI (blue, nucleus). e Representative CLSM images of 143B cells in a 1% O2 atmosphere treated with of Ru(II)-OH, NP2, and NP4 (10 μM Ru) for 6 h and stained with the lipid peroxide specific probe C11-BODIPY (green) and DAPI (blue, nucleus). f Flow cytometry plots of 143B cells in a 1% O2 atmosphere treated with of Ru(II)-OH, NP2, and NP4 (10 μM Ru) for 6 h and stained with the lipid peroxide specific probe C11-BODIPY. g Quantification from (f), n = 6 independent experiments. h Representative CLSM images of 143B cells under 1% O2 conditions treated with of Ru(II)-OH, NP2, and NP4 (10 μM Ru) for 12 h and stained with the hypoxia probe pimonidazole hydrochloride (green, hypoxia areas) and DAPI (blue, nucleus). Data are presented as mean ± SD. Statistical significance between every two groups was calculated by T-test, the statistical test used was two-sided.

