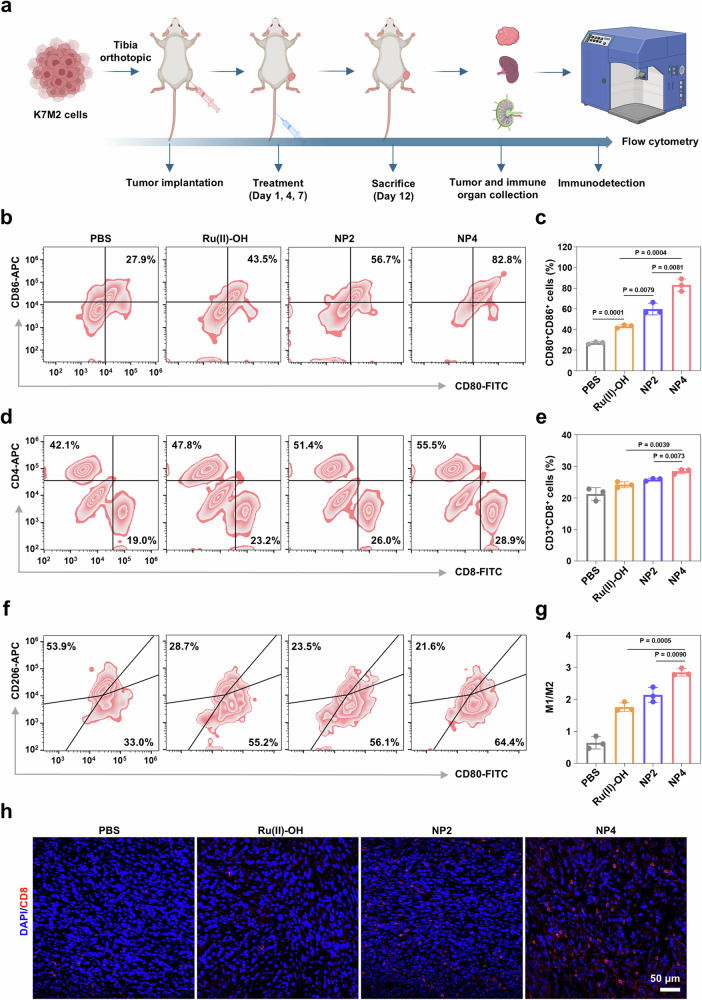
Fig. 8. The activation of immune responses by NP4 in vivo.
a Schematic treatment schedule. b, c The ratio of matured dendritic cells (CD80+, CD86+) in TDLNs collected from K7M2 mouse models subjected to different treatments. (n = 3 mice). d, e The ratio of effector T cells (CD8+ T cells and CD4+ T cells) collected from K7M2 mouse models subjected to different treatments. (n = 3 mice). f, g The ratio of M1-type macrophage (F4/80, CD80+) and M2-type macrophage (F4/80, CD206+) in tumor tissue collected from K7M2 mouse models subjected to different treatments. (n = 3 mice). h Immunofluorescence imaging of the infiltration of CD8+ T cells in tumor tissues after various treatments. Data are presented as mean ± SD. n = 3 mice. Statistical significance between every two groups was calculated by T-test, the statistical test used was two-sided. Figure 8a Created with BioRender.com released under a Creative Commons Attribution-NonCommercial-NoDerivs 4.0 International license.

