
Figure 2.
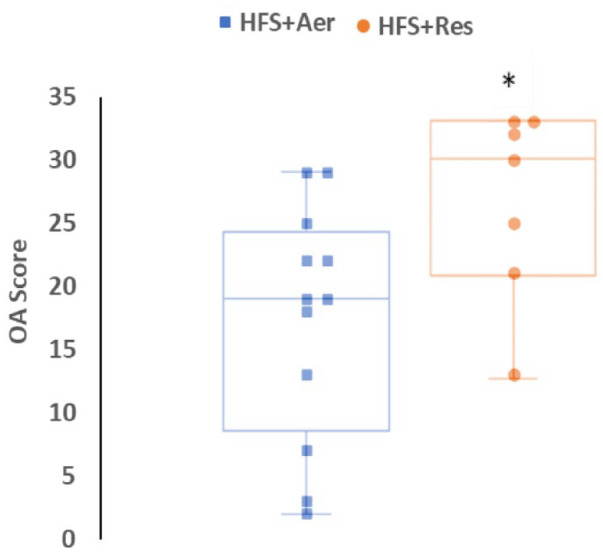
Knee joint damage assessed using total knee joint OA scores. Data presented as box plots showing the median and interquartile ranges and the individual values for animals fed an HFS diet subjected to aerobic exercise (HFS+Aer) and animals fed an HFS diet subjected to resistance exercise training (HFS+Res). OA = osteoarthritis; HFS = high fat/high sucrose; HFS+Aer = HFS diet subjected to aerobic exercise; HFS+Res = HFS diet subjected to resistance exercise.
aA significant difference at P < 0.05.