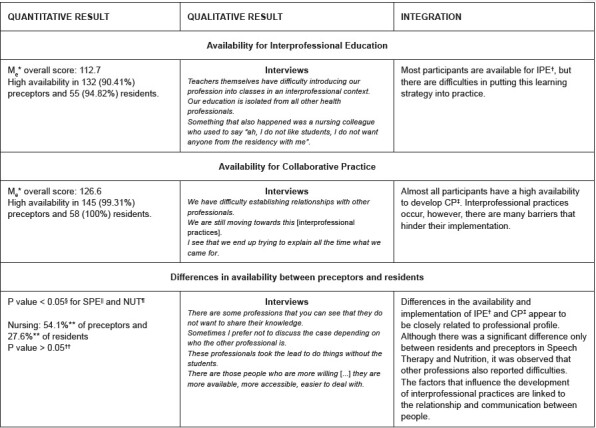
Figure 1. - Joint-display for integration of quantitative and qualitative data. Florianópolis, SC, Brazil, 2023.

*M e = Mean; † IPE = Interprofessional Education; ‡ CP = Collaborative Practice; §Mann-Whitney U test; || SPE = Speech Therapy; ¶NUT = Nutrition; **Highest frequency of responses; †† Kruskal-Wallis test
