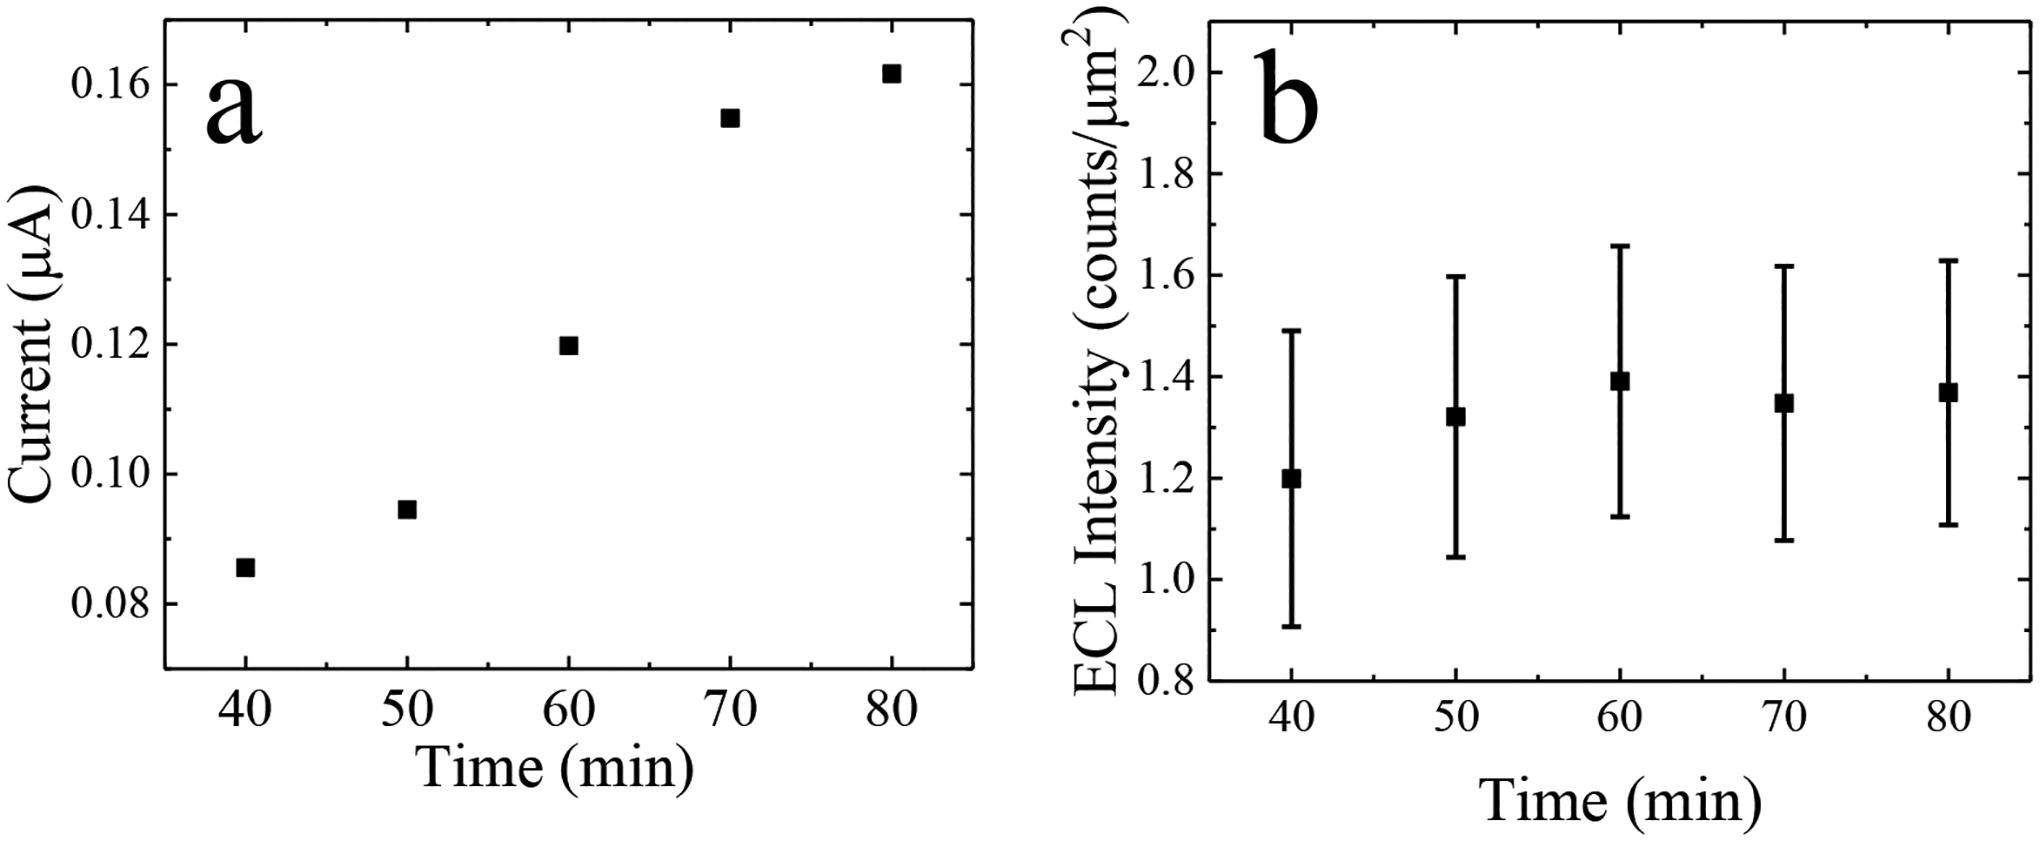
Figure 3.

(a) Plot of current measured between driving electrodes 2 and 3 versus incubation time. CAs were obtained at a potential step of +1.73 V for 30 s at each 40, 60, 70, 80, 90 min incubation times. (b) Average ECL intensity obtained at 5 iBPEs versus incubation time plot. ECL intensity was integrated for 10 s from t = 20s to 30s after the applied potential step.
