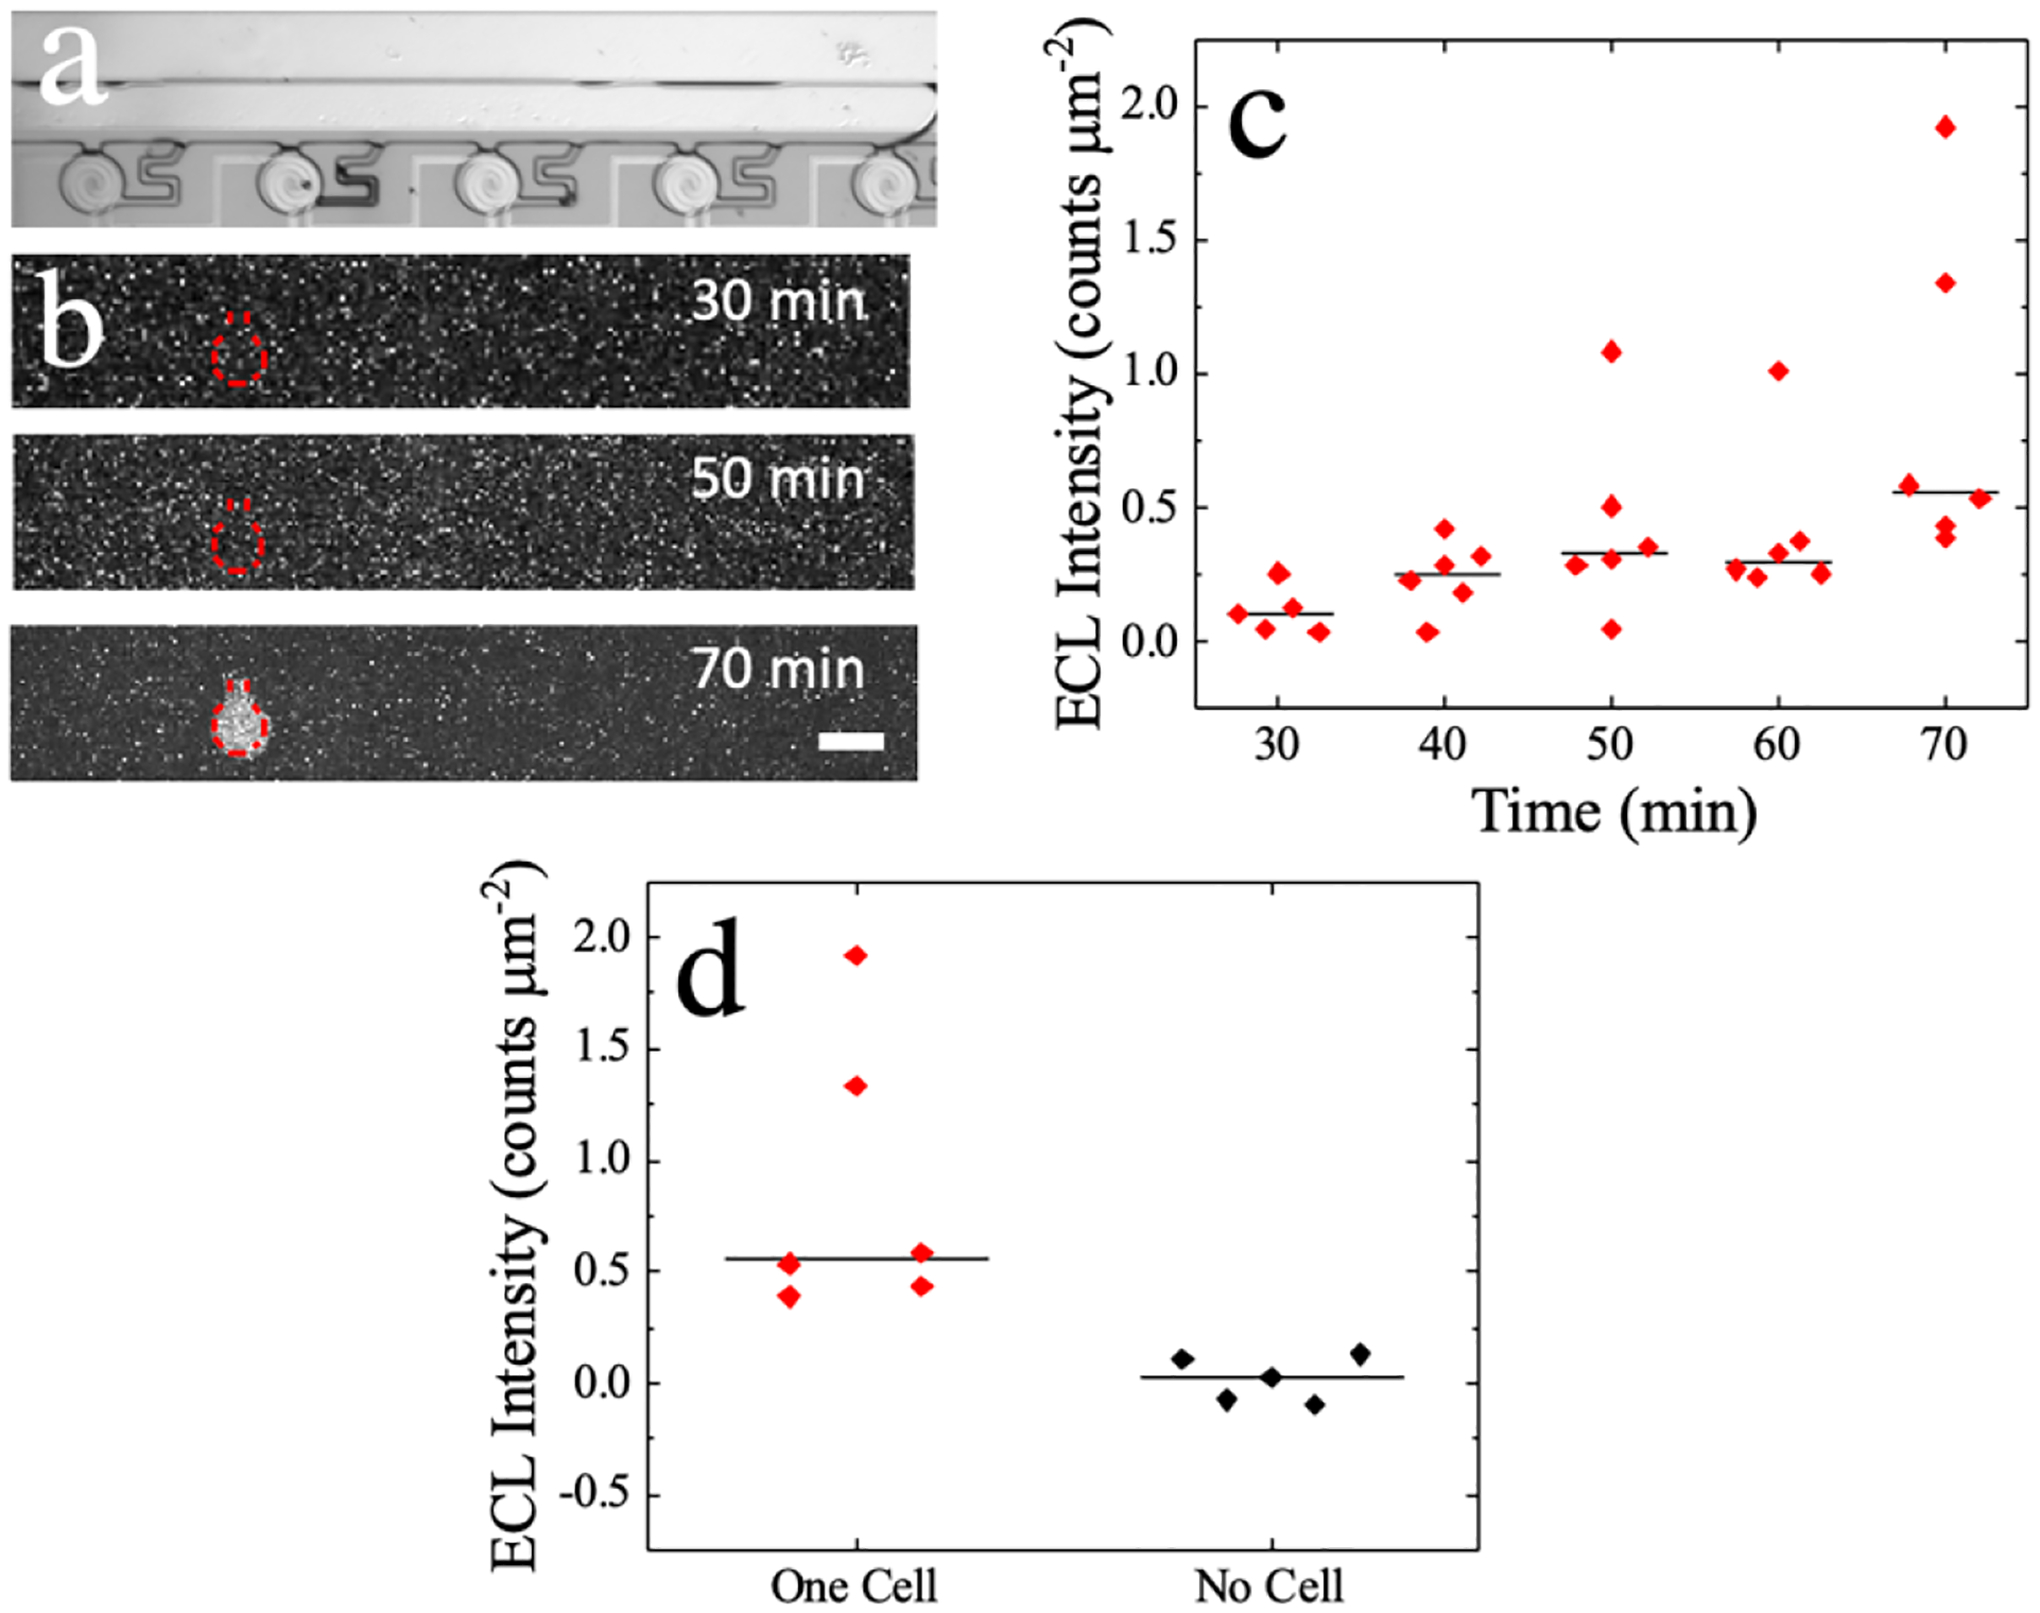
Figure 6.

(a) Brightfield image of cells captured in chamber. (b) Darkfield image showing ECL at the BPE reporting pole at 30-, 50-, and 70- min of eELISA. Scale bar, 100 m. (c) Plot of ECL intensity over a 70 min incubation time for five different cell-containing chambers. (d) Plot of ECL intensity at 70 min incubation time for chambers containing one cell compared to empty chambers (no cell).
