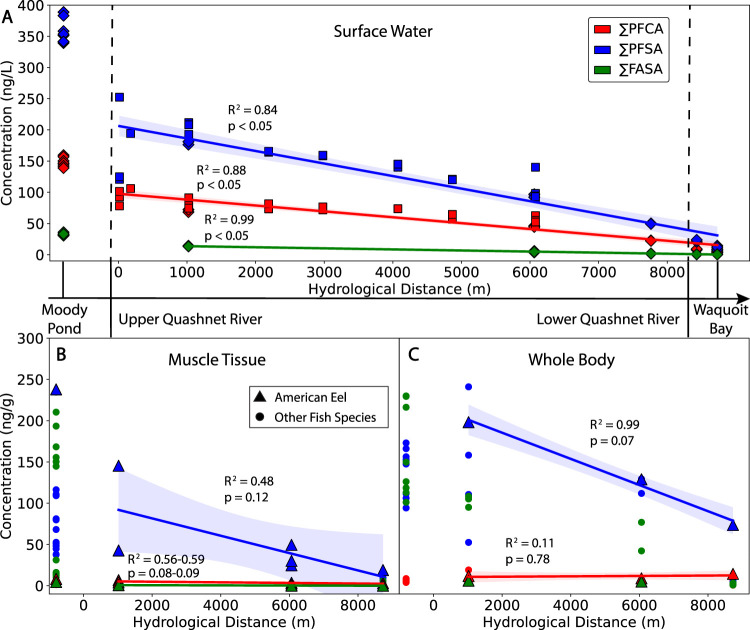
Figure 4.
Decline in targeted sum concentration (ng L–1 or ng g–1 wet-weight) of perfluorocarboxylates (∑PFCA), perfluorosulfonates (∑PFSA), and perfluoroalkyl sulfonamides (∑FASA) by site and with hydrological distance for (A) surface water, (B) fish and eel muscle tissue, and (C) fish and eel whole-body samples. The Quashnet River surface water samples include data from this study (diamonds) and Ruyle et al.7 (squares). Best fit (R2 and p-values) represent weighted least-squares linear regression (colored lines) with 95% confidence intervals (shaded areas) for surface water samples (diamonds/squares) and eel muscle tissue and whole-body samples (triangles) from the river and estuary.

