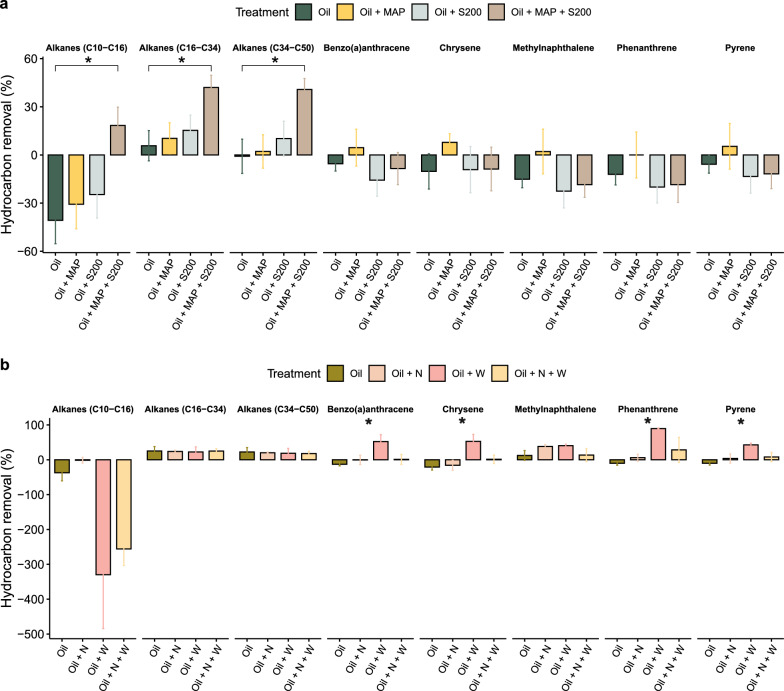
Fig. 3.
The assessment of hydrocarbon removal efficiency through total petroleum hydrocarbon analysis in two column experiments. a The bar chart displays a comparison of hydrocarbon removal rates in Column Experiment I (CI) for treatments: oil only (Oil), oil with inorganic fertilizer, MAP (Oil MAP), oil with oleophilic fertilizer, S200 (Oil S200), and oil with both fertilizers (Oil MAP + S200). b The bar chart illustrates hydrocarbon removal rates for treatments in Column Experiment II (CII): oil only (Oil), oil with both fertilizers (Oil + N), oil with SWA (Oil + W), and oil with both fertilizers and SWA (Oil + N + W). In panel a, the " *" indicates a significant difference (p < 0.05, t-test) between the oil only group and the oil with both fertilizers group, while in panel b, the " *" denotes a significant difference across the four different treatments (p < 0.05, ANOVA)

