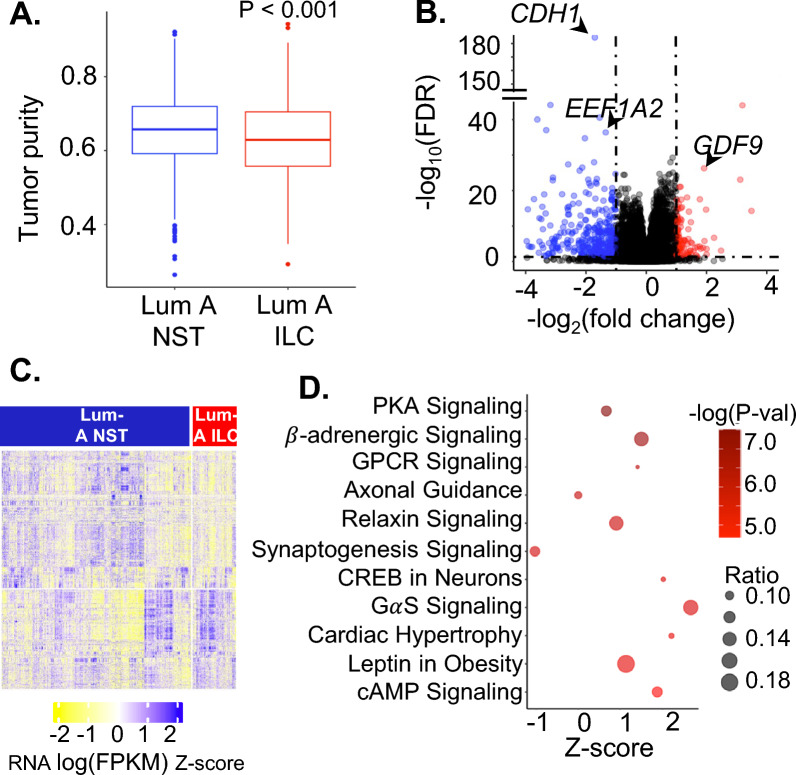
Fig. 1.
A Box plot depicting tumor purity of Luminal A ILC and Luminal A NST based on gene expression data from SCAN-B estimated by package ESTIMATE. B Volcano plot for differential gene expression between Luminal A ILC and Luminal A NST in SCAN-B using DESeq2; red = genes with log(FC) > 1 and FDR < 0.05 and blue—genes with log(FC) < 1 and FDR < 0.05. Data points representing CDH1, EEF1A2 and GDF9 are labeled. C Heatmap showing RNA expression (logFPKM z-scores) of differentially expressed genes in Luminal A ILC and Luminal A NST in SCAN-B. D Bubble plot depicting z score (represents overall effect on pathway in Luminal A ILC, z-score > 0 suggests upregulation and z-score < 0 suggests downregulation) on x-axis, -log(P-val) as color, and ratio (ratio of differentially expressed genes in the pathway to total number of genes in the pathway) as bubble size, for significantly enriched pathways identified by ingenuity pathway analysis of top 1000 most differentially expressed genes between Luminal A ILC and Luminal A NST (FDR < 1E-08). ILC—Invasive lobular breast cancer; NST—Invasive carcinoma—no special type; Lum A—Luminal A; SCAN-B—Sweden Cancerome Analysis Network—Breast; FDR—False Discovery Rate; KEGG—Kyoto Encyclopedia of Genes and Genomes; LogFC—Log to the base 2 of fold change; FPKM—Fragments Per Kilobase of transcript per Million mapped reads

