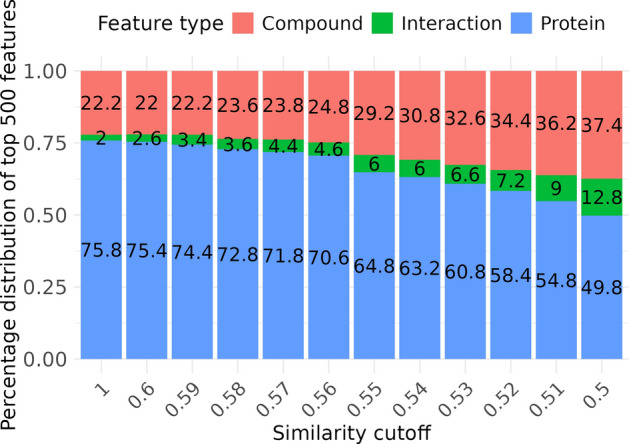
Fig. 11.

Proportion of the top 500 features by type across different similarity cutoffs. This plot illustrates the distribution of feature types among the top 500 features ranked by mean absolute SHAP values: compound (ECFP4), interaction (IFP), and protein (sequence). The features are identified from models trained on datasets filtered by different similarity cutoffs and evaluated on a consistent test set. The X-axis represents the similarity cutoff values, whereas the Y-axis represents the percentage distribution of each feature type. The colors indicate the feature types: orange for compounds, green for interactions, and blue for proteins.
