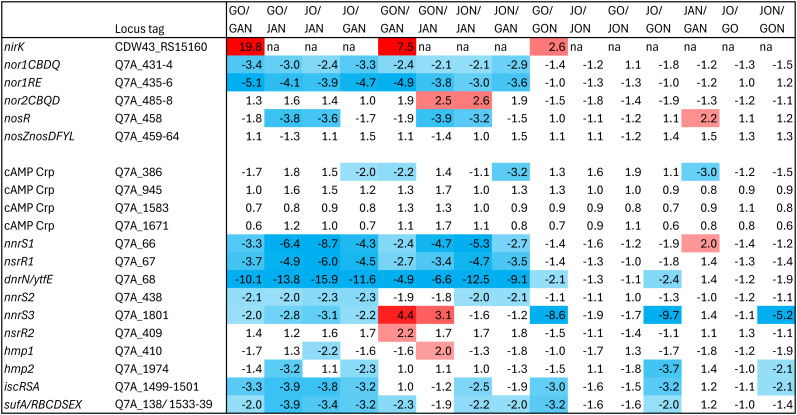
Figure 4. Fold changes in the relative transcript levels of denitrification genes and regulatory genes.
Genes that were significantly differentially expressed were identified by EdgeR (v 3.36.0). Locus tags are from strain JAM1T GenBank annotation (CP003390.3) except nirK that is from strain GP59 GenBank annotations (CP021974.1). Values correspond to fold changes (FC) between one condition to the other. In GO/GAN, for example, positive values refer to genes with relative transcript levels higher in the < <O > > conditions than those in the < <AN > > conditions, and negative values refer to the opposite. FC > 2 (red) or < −2 (blue) that have FDR < 0.05 are highlighted by colors. G, strain GP59; J, strain JAM1T. O, AN, ON: < <O > >, < <AN > > and < <ON > > conditions, respectively.

