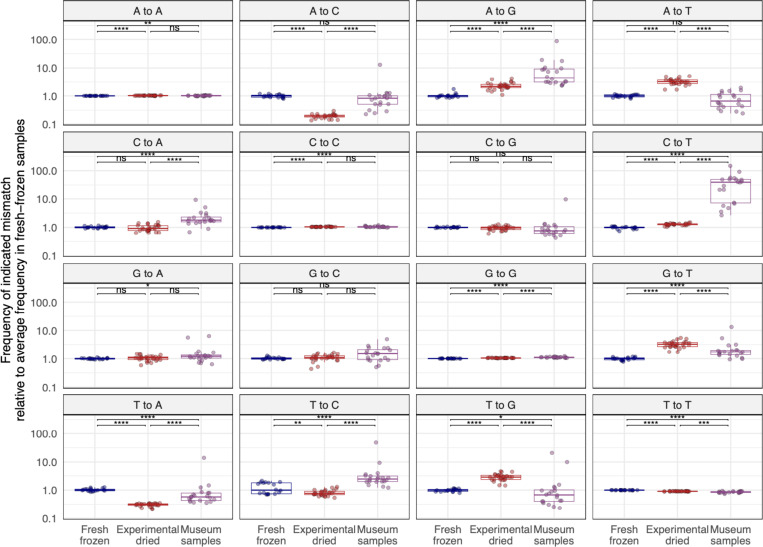
Figure 11. Old RNA was chemically damaged and exhibits mismatch patterns consistent with cytosine and adenine deamination.
Mismatches in rRNA-mapping reads from D. melanogaster datasets were quantified and the frequency of each mismatch type relative to the median frequency in fresh-frozen datasets is plotted. Each point represents a dataset from an individual fly. Adjusted p-values significance levels from Wilcoxon test are indicated.

