
Figure 3: Population structure in S. mansoni laboratory populations.
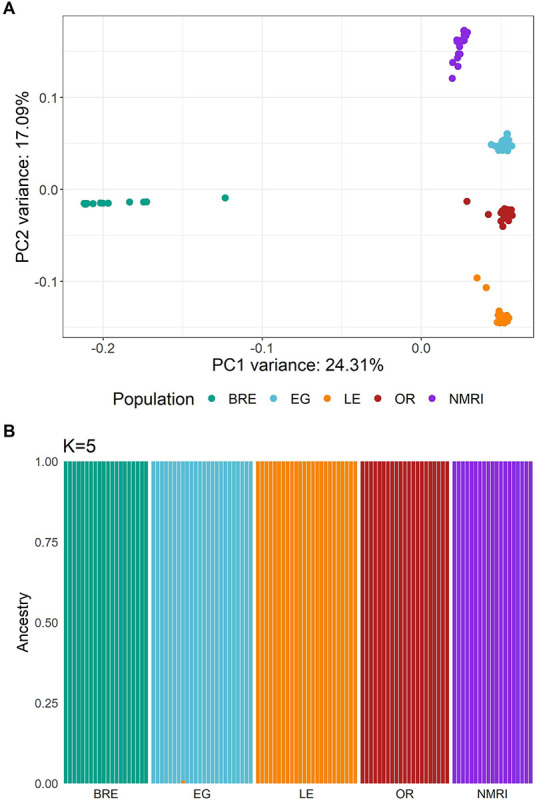
Both plots demonstrate the separation of each population with the exception of SmBRE and SmLE. (A) PCA plot showing clustering of sequenced S. mansoni laboratory populations. (B) Admixture analysis with k = 5 populations.