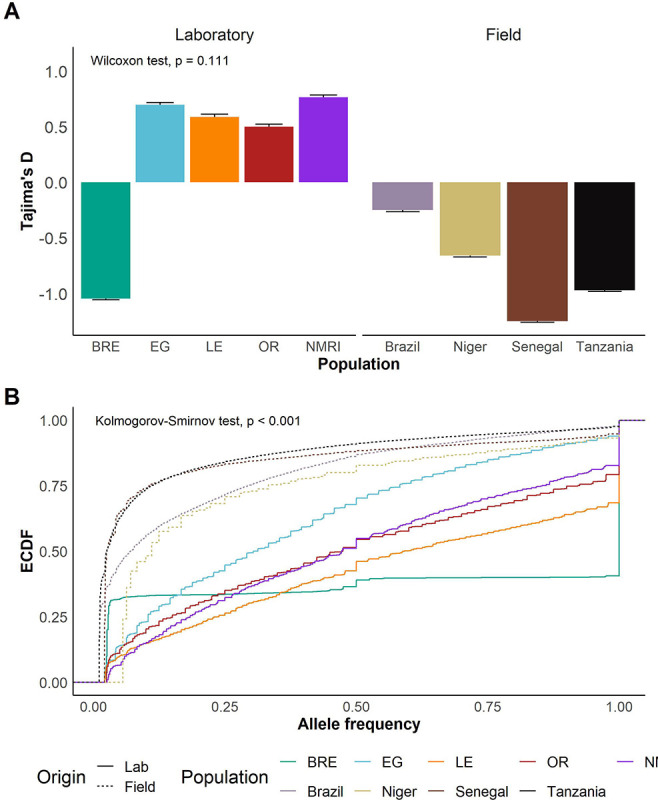
Figure 5: Indicators of recent bottlenecks in laboratory populations.

(A) Bar plots showing mean and standard error of Tajima’s D in each population. A t-test was used to compare means of Tajima’s D in field and laboratory populations. (B) Line plot showing the empirical cumulative distribution function (ECDF) of allele frequencies in each population. Kolmogorov-Smirnov test was used to compare field vs laboratory distributions.
