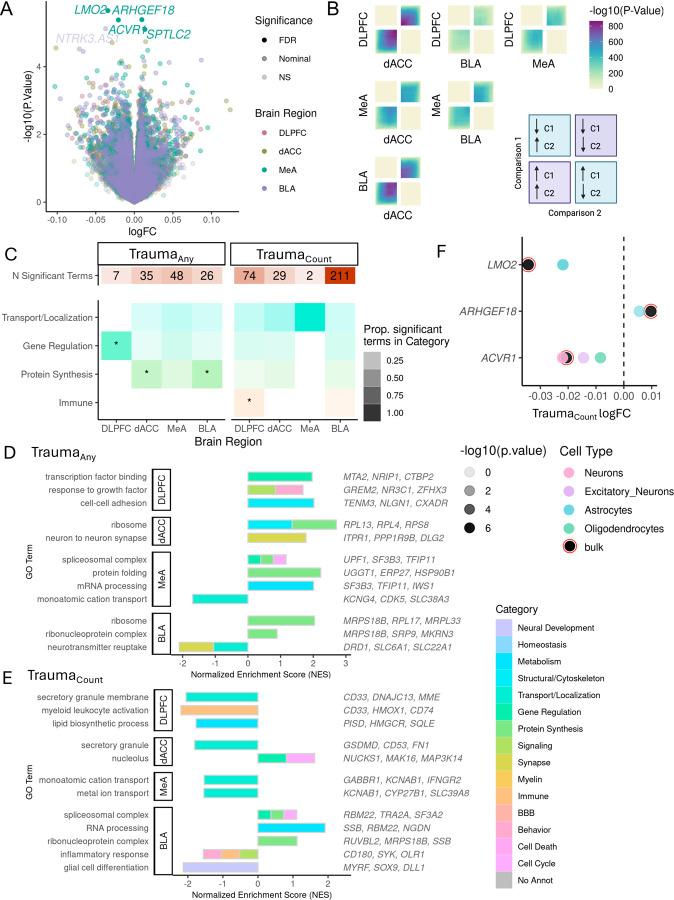
Figure 1.
Transcriptional signatures of trauma exposure (Traumaany) and accumulation (TraumaCount). A. Gene-level expression associations with cumulative trauma (traumaCount). Log-fold-change (logFC) values associated with each additional trauma (1 unit increase in trauma load) and −log10 transformed raw p-values for each gene is shown. FDR significance < 5% and nominal significance is p< 0.05. Only trauma-leading gene associations are highlighted and included in follow up analyses. DLPFC = Dorsolateral prefrontal cortex, dACC=dorsal anterior cingulate cortex, MeA=Medial amygdala, BLA= basolateral amygdala. B. Concordance of traumaCount transcriptional signatures for each brain region pair evaluated by stratified rank-rank hypergeometric overlap (RRHO) analysis. Bottom left quadrant indicates genes upregulated with trauma in both regions, upper right quadrant indicates genes downregulated with trauma in both regions. C. Gene Ontology term enrichment summary. Number of significant GO terms for each brain region for traumaAny and traumaCount. Overrepresentation of significant GO terms by functional category. Shading of tile indicates proportion of significant GO terms in each category over the total number of significant terms for each brain region and trauma measure. Categories significantly overrepresented (qFDR < 0.05) indicated with asterisk (*). D-E. Representative significant GO term associations from gene set enrichment analysis for traumaAny (D) or trauma Count (E) signature (p < 0.05 trauma-leading genes) for each brain region. Normalized enrichment score indicates degree of enrichment with positive direction indicating an enrichment of upregulated trauma genes and negative direction indicating an enrichment of downregulated trauma genes. Color of bar indicates functional category. F. Cell type differentially expressed genes (ctDEG) in association with traumaCount. Number of nominally significant (p<0.05) trauma-leading differentially expressed gene associations for each cell type (color bars) and brain region. G. MeA traumaCount gene associations from bulk analyses are driven by specific cell types. Gene-level logFC estimates from bulk tissue expression (black with red circle) and from imputed cell type expression (color points). Only nominally significant (p<0.05) estimates shown.

