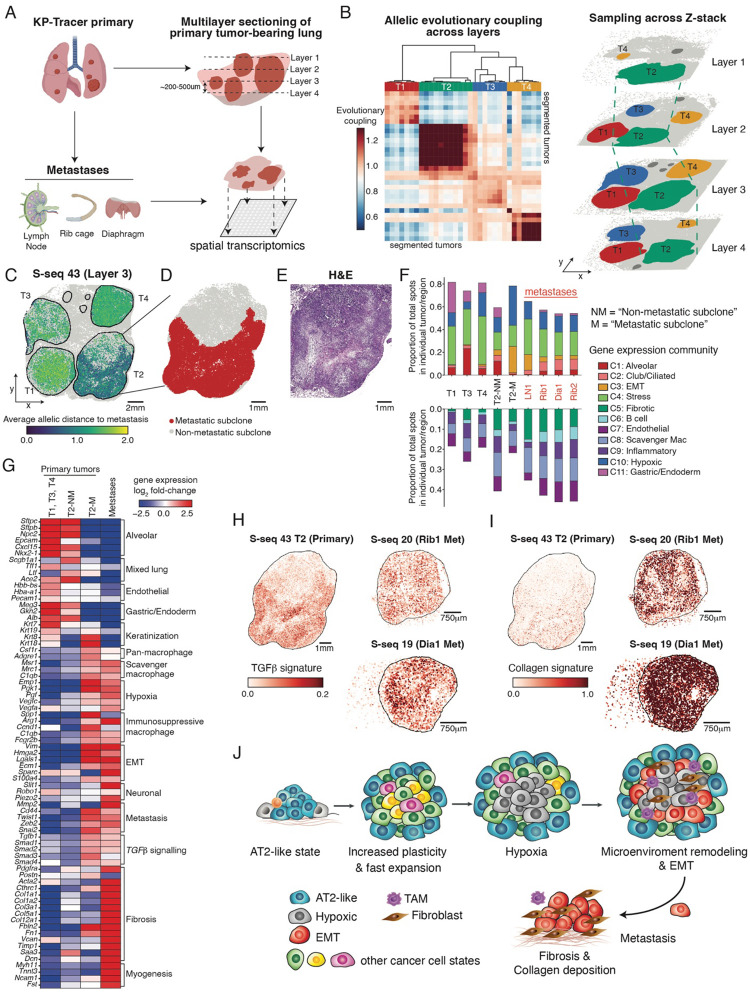
Figure 4. Tracing the evolution of subclonal niches across the metastatic cascade.
(A) Schematic of spatial transcriptomics workflow from a KP-Tracer mouse with large primary lung tumors and paired metastases from the lymph node, rib cage, and diaphragm. Multiple lung sections with four large primary tumors were harvested and subjected to both Slide-seq and Slide-tags assays. Biorender was used to create parts of this schematic.
(B) Coarse-grained alignment of Slide-seq spatial transcriptomics data (based on lineage-tracing edits) from four representative layers (Layer 1 – Layer 4) of a KP tumor bearing lung at approximately 200–500μm intervals from different z position. (Left) A clustered heatmap of allelic evolutionary coupling scores across all Slide-seq datasets from the tumor-bearing lung identifies the four major tumors. Each row or column is a single tumor from one Slide-seq dataset. (Right) 3D reconstruction of aligned datasets, annotated by one of four major tumors. Individual tumors are labeled in different colors.
(C) Representative spatial projection (S-seq 43) of allelic distances – summarizing how different lineage-tracing edits are between cells – for each spot with lineage-tracing data. Distance was computed to a consensus metastatic parental allele and normalized between 0 and 2.
(D-E) The metastasis-initiating subclone in T2 was segmented from cells with high relatedness to metastatic tumors and labeled in red. (E) H&E staining of T2.
(F) Proportion of gene expression community across representative stages of the metastatic cascade, including primary lung tumors (T1,3,4) without relatedness to metastases, the metastasis-initiating (M) and non-metastatic-initiating (NM) subclones in the primary tumor (T2) that gave rise to metastases, and four metastases. Top: communities that are more related to tumor or epithelial programs. Bottom: communities that are related to stromal/immune programs.
(G) Heatmap of gene expression log2-fold-changes between environmental niche (primary tumors without metastatic relationship, non-metastasis-initiating (NM) and metastasis-initiating (M) subclones within T2, and metastases). Genes are manually organized into ontologies.
(H-I) Spatial projection of gene expression scores of the Hallmark TGFβ and Collagen gene signatures on the metastasis-initiating primary tumor and selected metastases. Tumor 2 on S-seq 43 is used as the representative layer.
(J) A schematic model of KP tumor evolution and microenvironmental remodeling.

