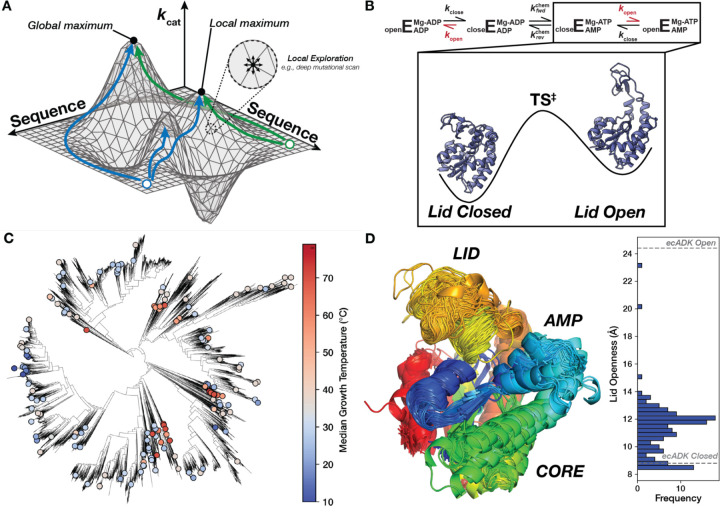
Figure 1. Mapping the sequence-catalysis of Adenylate Kinase across evolution.
(A) Similar to a physical landscape, individual positions along the surface correspond to different enzyme sequences, with the height at each position representing their respective catalytic parameters. Sequences that occupy the highest “peaks” have the highest catalytic activities. The sequence space is effectively continuous for many sequences, allowing us to conceptualize the adaptive landscape as a two-dimensional surface in a three-dimensional space (2, 5, 7). While Deep-Mutational Scanning exercises assay many sequences, they explore a narrow region of sequence space (one mutation from wild-type) and are liable to be stuck in local optima. Green and blue paths show possible paths explorable by evolution that reach unique optima. (B) Schematic of the ADK reaction, where E represents the ADK enzyme, with the rate-limiting step, kopen, shown in red (46). Experimental structures of closed (PDB: 4AKE) and open ecADK (PDB: 1AKE) are depicted on a simplified energy landscape for this reaction step. (C) The ADK sequence library characterized herein (dots) spans the bacterial tree of life, with organisms adapted to optimal growth temperatures ranging from the coldest to the hottest environments on Earth (114). (D) Superimposition of AlphaFold2 predictions of the ADK orthologs, with sequences trimmed to align with ecADK in an MSA. Measurements between the c-alpha of posistions 30 and 130 are histogrammed to display the range of observed LID “openness”, with measurements from experimental structures of ecADK in the open (PDB: 1AKE) and closed (PDB: 4AKE) conformations (61, 115).

