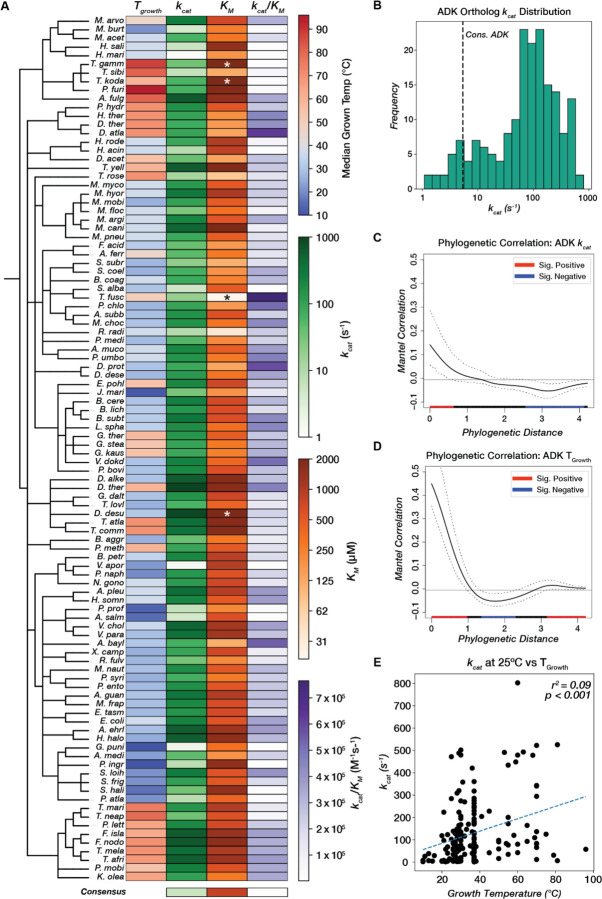
Figure 3. Adenylate kinase catalytic parameters span three orders of magnitude and correlate weakly with phylogeny and environmental conditions.
(A) Catalytic parameters and TGrowth values for 100/181 ADK orthologs (including those with KM outside the range of the assay) are displayed as a heatmap across a taxonomic tree (Methods). kcat and KM are colored on a log scale. Orthologs with KM outside the range of the assay are labeled with asterisks (*). See Fig. S7 for a heatmap of all 181 ADK orthologs. The consensus ADK sequence (94) is plotted at the bottom (kcat = 5.4 s−1, KM = 804 uM). (B) Measured kcat values for 175 orthologs span three orders of magnitude. The vertical dashed line represents the kcat for the ADK consensus sequence (94). (C,D) Phylogenetic signal analysis of (C) kcat and (D) TGrowth. Moran’s I index of autocorrelation is plotted as a solid black line, with the 95% confidence interval outlined by dashed black lines. The colored bar at the bottom encodes the significance of autocorrelation, with red and blue representing positive and negative significant autocorrelation, respectively, and black representing nonsignificant autocorrelation. (E) Linear regression analysis between optimal growth temperature and kcat. The regression line is plotted as a dashed blue line (r2 = 0.09, p < 0.001).

