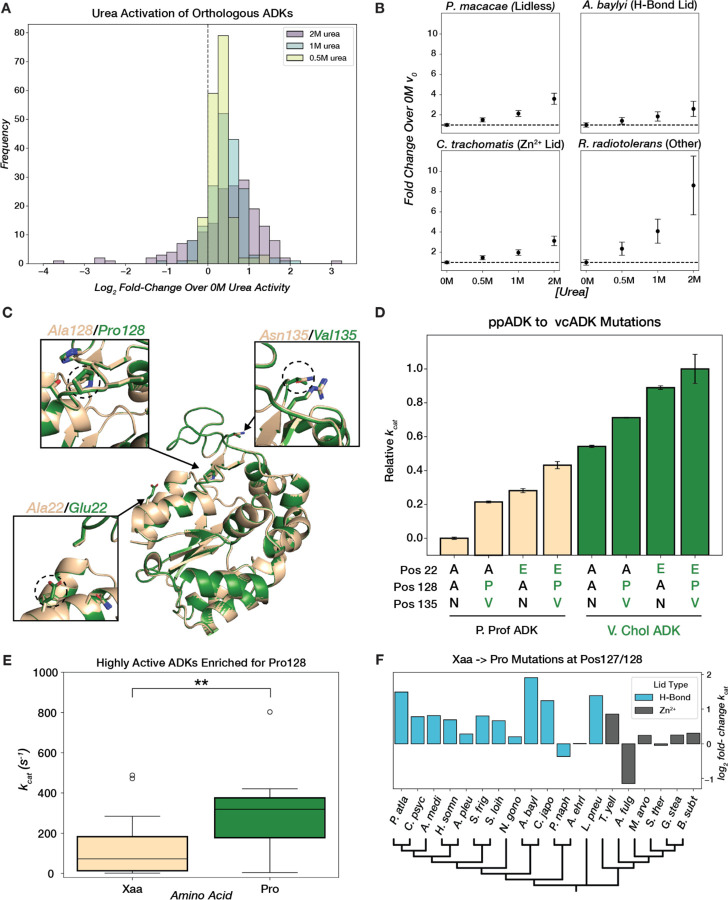
Figure 6. ADK conformational tuning with osmolytes and mutations across evolution.
(A) Distribution of log2 fold-change in initial reaction rate at saturating substrate concentration relative to 0M urea for 0.5M, 1M, and 2M urea. (B) Mean fold-change in initial rate over 0M urea at 4mM [substrate]. Error bars represent standard deviation across replicates. The black dashed line represents no change in initial rate. (C) Superimposed AF2 models of ppADK (tan) and vcADK (green) with positions 22, 128, and 135 highlighted. (D) Barplot of mean relative catalytic effects (technical replicates, n=2) of mutations at key positions that differ between ppADK and vcADK. Error bars represent standard deviation across replicates. Variants in ppADK background are plotted in tan and vcADK background in green. Amino acid identity at positions 22, 128, and 135 are displayed below each bar. kcat values for ppADK and vcADK mutants were collected off-chip (see Methods). (E) Boxplot of kcat for H-Bond LID ADKs that have a proline (green) or different amino acid (tan) at position 128. t(37)=-3.162, p=0.003. (F) Barplot of log2 fold-change in kcat for Xaa→Pro mutations in selected ADKs with either an H-Bond or Zn2+ LID, organized by a phylogenetic tree (plotted with arbitrary branch lengths).

