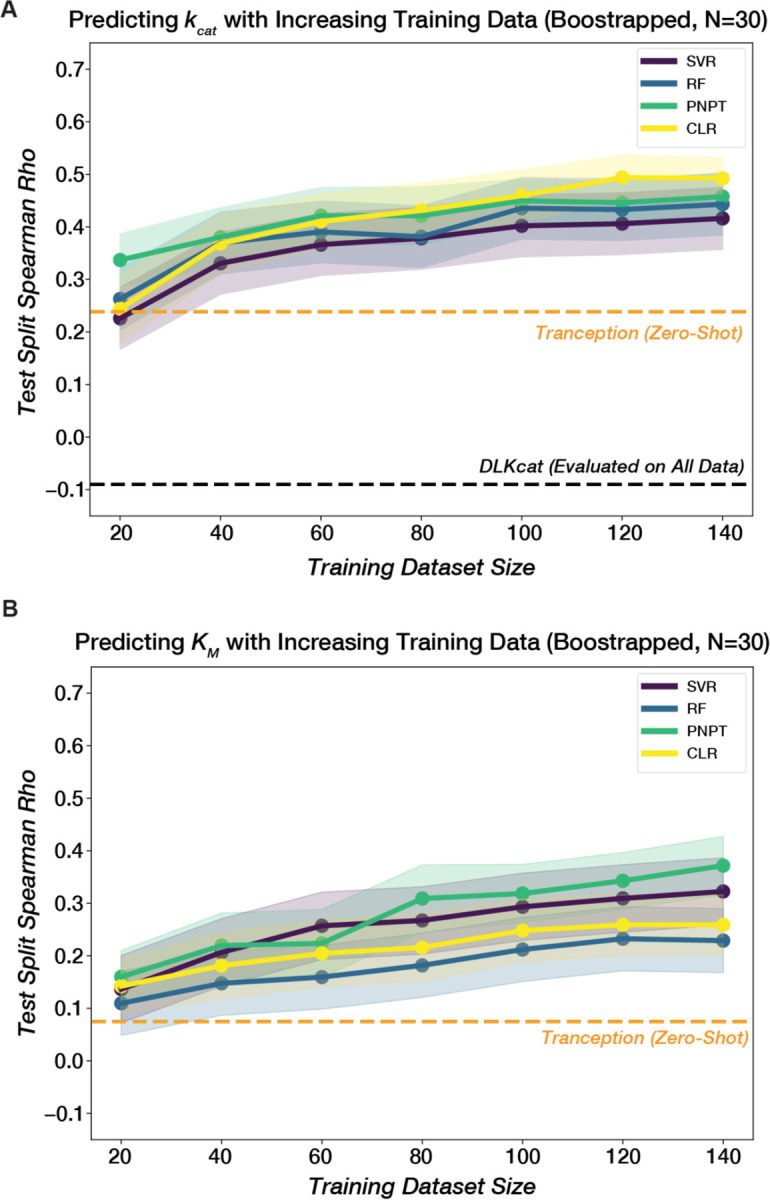
Figure 8. Improving kcat and KM prediction for ADK sequences with semi-supervised learning.

The mean test spearman rho for different models across 30 samplings is plotted against training dataset size for (A) kcat and (B) KM. Models include Random Forest (RF), Support Vector Regression (SVR), ProteinNPT(PNPT) (107), and Convolutional Linear Regression (CLR) (107). For embeddings, SVR used a One-hot encoded MSA, RF used ESM-2 embeddings, and CLR and PNPT used Tranception(112) embeddings. Embeddings and other model hyperparameters were selected based on aggregate (mean) performance for both kcat and KM prediction. Shaded regions represent 95% confidence intervals across 30 training/test set samplings at each dataset size (Methods). A zero-shot evaluation of the Tranception PLM (112) is plotted as a dashed orange line. DLKcat (109) performance evaluated on all 175 sequences is plotted in (A) as a dashed black line.
