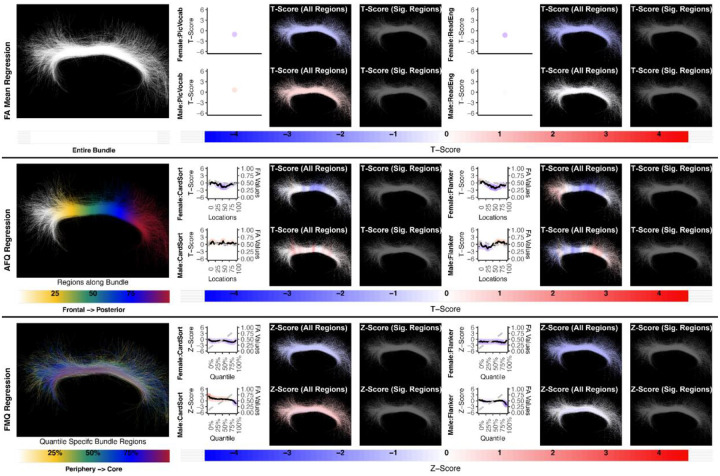
Figure 10:
The association between CB right and executive function performance. None of the methods identify a statistically significant association. Studied bundle regions are shown at left. For each experiment, plots of Z- or T-scores (solid line) and FA (dashed line) are provided, with red asterisks indicating FDR-corrected statistical significance. Studied bundle regions are shown at left. For each experiment, plots of Z- or T-scores (solid line) and FA (dashed line) are provided, with red asterisks indicating FDR-corrected statistical significance. Visualizations of Z- and T-scores are provided.

