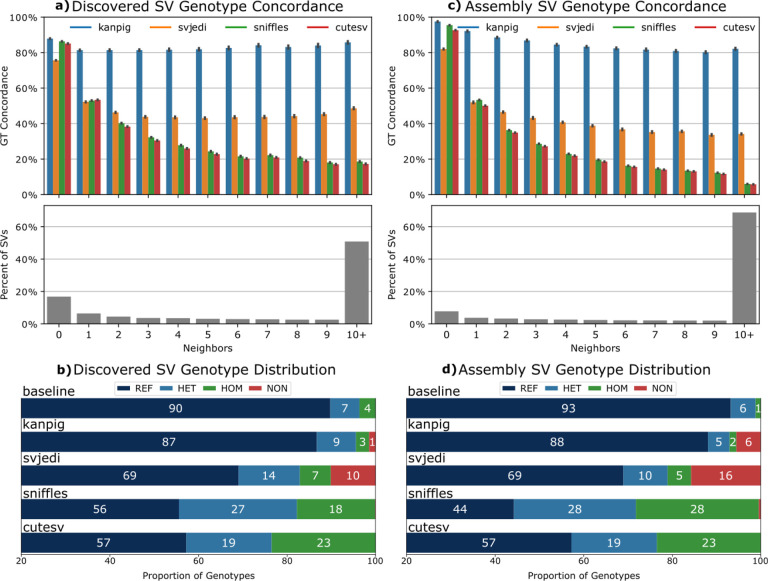
Figure 3. Multi-sample SV genotyping performance.
Genotype concordance by number of neighbors for discovered SVs (a) and assembly-derived SVs from 47 samples (b). Genotype distribution for discovered (c) and assembly-derived SVs (d). For b & d, the x-axis has been truncated to 20%-100% for readability. For b, the baseline corresponds to the original sniffles discovery genotypes without full genotyping and all missing (‘./.’) genotypes assumed to be reference homozygous. REF = reference homozygous, HET = heterozygous, HOM = homozygous alternate, NON = Missing genotype (./.). Bar plot error bars represent 95% confidence intervals.

