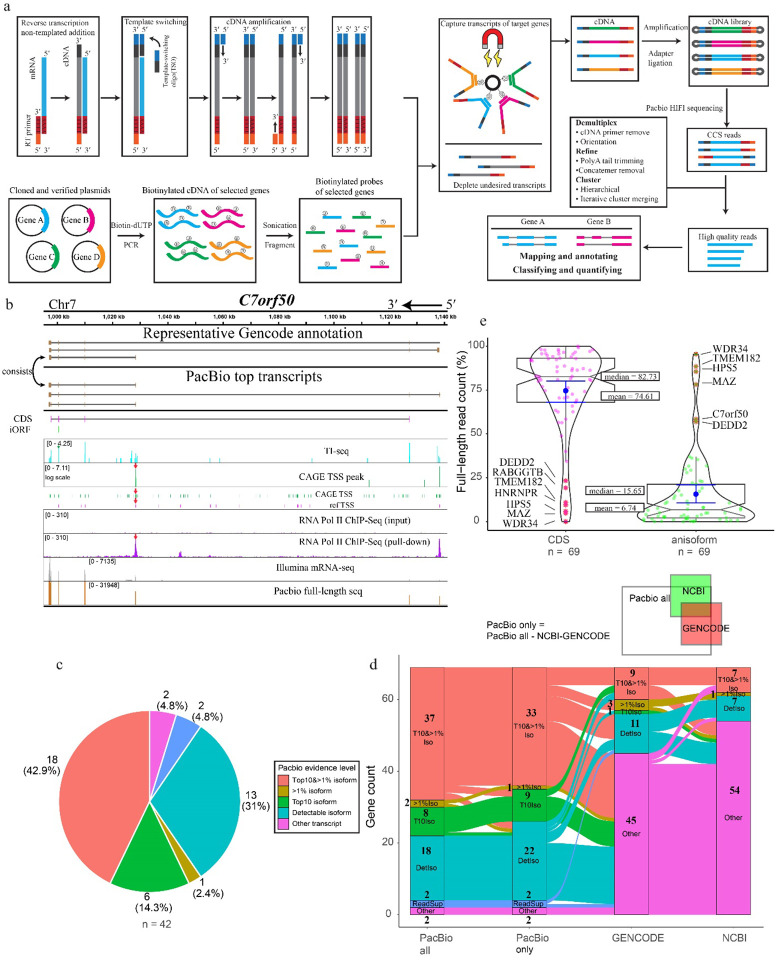
Fig. 4. ORF-capture and long-read sequencing to confirm, reveal and quantify anisoform alternative transcripts.
a, Schematic showing the workflow of ORF-capture full-length sequencing and data analysis. Full-length first strand cDNA was synthesized with poly(T) reverse transcription primers from the 3’ end and further extended over the 5’ end by template switching. Simultaneously, plasmids containing cloned cDNA of target genes were PCR-amplified with biotin-dUTP to generate biotinylated cDNA, which was then fragmented to create biotinylated probes. The cDNA of targeted genes was enriched using biotinylated probes and streptavidin beads. Following amplification and library preparation, the cDNA was sequenced using PacBio Sequel II. The resulting HiFi reads were processed to retain only high-quality full-length reads. Finally, the processed reads were mapped to the genome to obtain transcript information. b, Evidence for alternative transcripts encoding the C7orf50 anisoform. Top, representative transcripts deposited in GENCODE. Below, PacBio full-length transcripts by read count. Taupe boxes represent exons. The positions of the C7orf50 CDS (magenta) and anisoform-encoding iORF (green) are represented below the transcript diagrams. Reanalysis of TI-seq (cyan) and CAGE TSS (FANTOM5, green, and NCBI reference TSS, pink) from HEK293 cells, as well as RNA PolII CHIP-seq33 (purple), reveals peaks (red arrows) supporting the internal TSS governing anisoform expression. More detailed views can be found in Extended Data Fig. 5. c, Pie plot shows the distribution of the strongest evidence for each anisoform transcript, categorized into “Top 10 & >1% isoform,” “Top 10 isoform,” “>1% isoform,” “Detectable isoform,” “Read support,” and “Other transcript”. Genes from the test set (42/69) lacking anisoform-encoding transcript evidence in NCBI were selected for analysis. PacBio full-length sequencing data for each gene were inspected for the presence and evidence level for anisoform transcripts. “Top10&>1% isoform” signifies isoforms ranking in the top 10 by read count for the gene, with read percentages exceeding 1%. “>1% isoform” refers to isoforms where read percentages exceed 1% of the gene’s total. “Top10 isoform” denotes isoforms within the top 10 by read count. “Detectable isoform” categorizes those isoforms not in the top 10 and with read counts not surpassing 1%. “Other transcript” refers to transcript isoforms that do not encode the iORF. d, Alluvial plot illustrating the distribution and transitions of PacBio evidence levels for transcript isoforms across four categories: “PacBio All” (all detected isoforms), “PacBio Only” (isoforms not shown in previous annotations), “GENCODE”, and “NCBI”. The plot visualizes the flow of transcript variants from those detected by PacBio (first column), to those uniquely identified by PacBio sequencing (second column), and then compared against existing annotations in the “GENCODE” and “NCBI” databases (third and fourth columns respectively). Each stream represents transitions across different evidence levels, including “Top 10 & > 1% isoform”, “Top10 isoform”, “>1% isoform”, “detectable isoforms”, “read support isoform”, and “other transcript”. The “read support isoform” refers to instances where Isoseq 3 did not call the isoform, but raw reads clearly indicate its existence. Each stream represents a unique gene, illustrating the alignment or discrepancy between PacBio findings and established genomic annotations. e, Violin plot illustrating the relative abundances of iORF vs. CDS-encoding transcripts detected by PacBio. The coding ability was assigned based on the first start codon within the mRNA sequence. The left violin plot represents the full-length read count percentage for CDS-encoding transcripts, while the right plot illustrates the full-length read count percentage for iORF-coding alternative transcripts. Median and mean values are indicated for each group. Genes with more than 50% read count for an anisoform-encoding alternative transcript are labeled.

