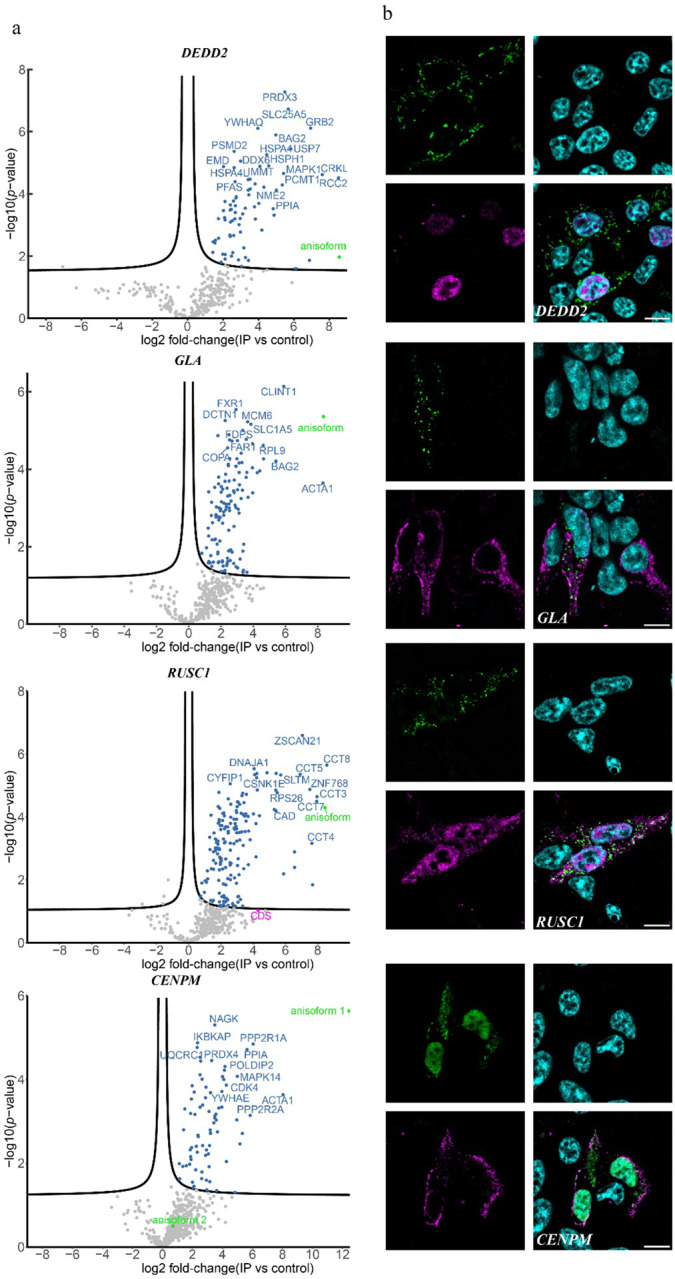
Fig. 5. Anisoforms have biological functions distinct from the proteins they overlap.

a, Volcano plots for proteins enriched by anisoform co-immunoprecipitation and label-free proteomics (co-IP-MS). The anisoforms were overexpressed in HEK293T cells using plasmids shown in Fig. 3a and subjected to anti-FLAG co-IP, with (empty vector/untransfected cells) as the negative control, in biological triplicate. The green dots represent the anisoform baits. The threshold line indicates a 5% FDR (false discovery rate). b, Immunofluorescence (IF) showing the distinct cellular locations of anisoforms and their corresponding overlapping proteins. The anisoforms and canonical proteins were tagged with FLAG (green) and HA (magenta), respectively; DAPI counterstain is shown in cyan. Scale bars, 10 μm.
