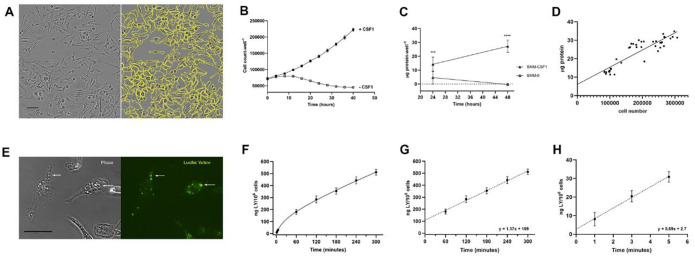
Figure 1. Macrophages growing in rich medium are highly pinocytic.
(A) Images of macrophages growing in BMM. Left image shows phase contrast image of macrophages in a 24-well tissue culture plate in the Incucyte SX1. Right image shows calculated cell outlines (yellow) used to determine cell numbers per well. Scale bar: 50 μm.
(B) Cell numbers per well of macrophages growing in BMM, +/− CSF1, as measured hourly. Measurements from every 4 hrs are shown. Data show mean and SEM obtained from 9 wells per time point (3 biological replicates).
(C) Protein accumulation by cells growing in BMM, +/− CSF1, measured from cell lysates collected at 24 and 48 hrs. Differences measured at each time point with and without CSF1 were significant (***, p<0.001; ****, p<0.0001). Data show mean and SEM of protein*well−1, obtained from 9 wells per condition (3 biological replicates).
(D) Measurement of protein content per cell in BMM. The plot shows the relationship between cell number per well and μg protein per well (3 biological replicates). The mean protein content was 93 pg*cell−1 (linear regression: μg protein/well = (.000093 μg protein/cell x cell number/well) + 6.1 μg protein/well, R2 = 0.79).
(E) Macropinosomes in macrophages in CSF1. Macrophages on coverslips (MatTek dishes) were incubated in 500 μg*ml−1 LY in BMM/CSF1 for 5 min, then were washed free of LY and fixed for microscopic observation of phase contrast (left) and LY fluorescence (right). Scale bar: 20 μm.
(F) Time course of LY accumulation by cells growing in BMM. Cells were lysed after 1, 3, 5, 60, 120, 180, 240 and 300 min in BMM/CSF1 with 500 μg*ml−1 LY before washing and lysis. Fluorescence and protein content of each well were measured. Protein was converted to cell number to obtain ng LY per 106 cells. Data show mean and SEM from 9 wells per time point (3 biological replicates).
(G) Rate of LY accumulation. Linear regression of data in panel F, 60–300 minutes. Slope = 1.37 ng LY*106 cells−1*min−1, b=109, R2=0.95 (= 82 ng LY*106 cells −1*hr−1, = 164 fl fluid*cell−1*hr−1).
(H) Rate of influx. Linear regression of data in panel F, 1–5 minutes (influx). 5.7 ng LY*106 cells−1*min−1, b=2.7, R2=0.90 (= 342 ng LY*106 cells −1*hr−1, = 683 fl fluid*cell−1*hr−1).

