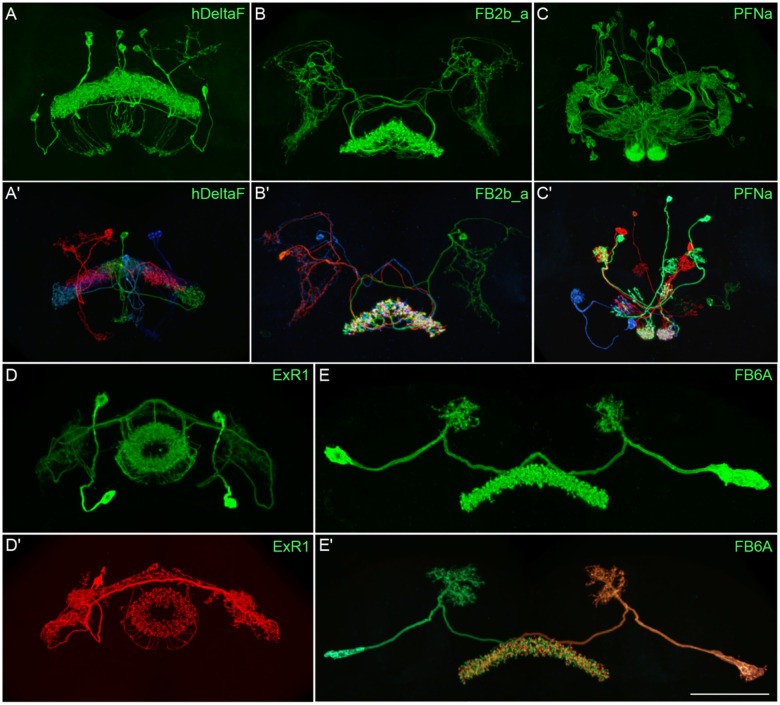
Figure 3.
Visualization of the entire expression pattern of a split-GAL4 line for the indicated five cell types revealed using UAS-myrGFP (A-E). A subset of individual cells within those same cell types (A’-E’) are revealed by stochastic labeling using the MCFO method (Nern et al. 2015). The scale bar in E’ refers to all panels and = 50 μm. Images are maximum intensity projections (MIPs). Stable split lines used were as follows: A, SS54903; A’, SS53683; B and B’, SS49376; C and C’, SS02255; D, SS56684; D’, SS56803; E and E’, SS57656. The original confocal image stacks from which these images were taken are available at www.janelia.org/split-GAL4.

