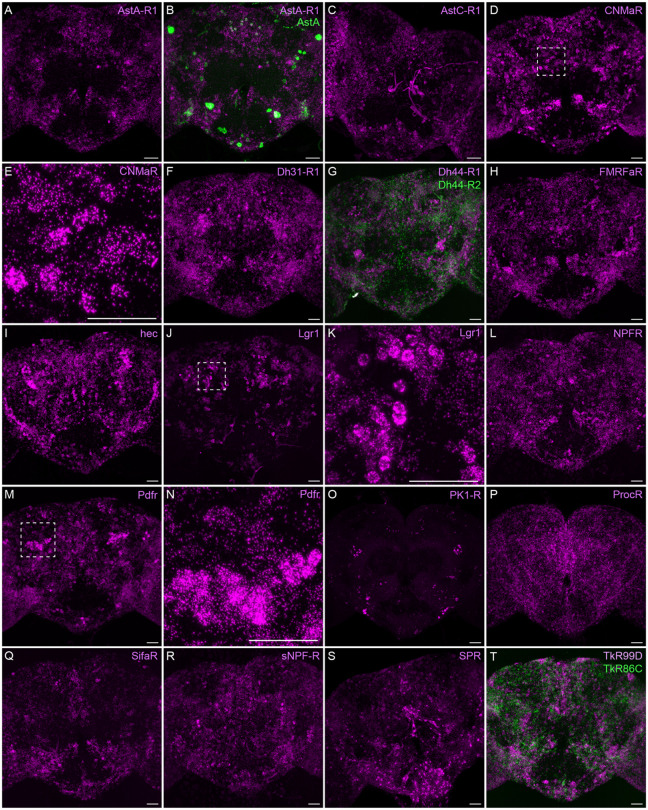
Figure 7.
Neuropeptide receptor gene expression. EASI-FISH was used to examine the expression of the indicated neuropeptide genes in the central brain. Higher magnification views of regions of the brains shown in D, J and M (indicated by dashed boxes) are shown in E, K and N. Images are MIPs. Scale bar in each panel = 50 μm; note that the images shown are from brains that were expanded by about a factor of two during the EASI-FISH procedure.

