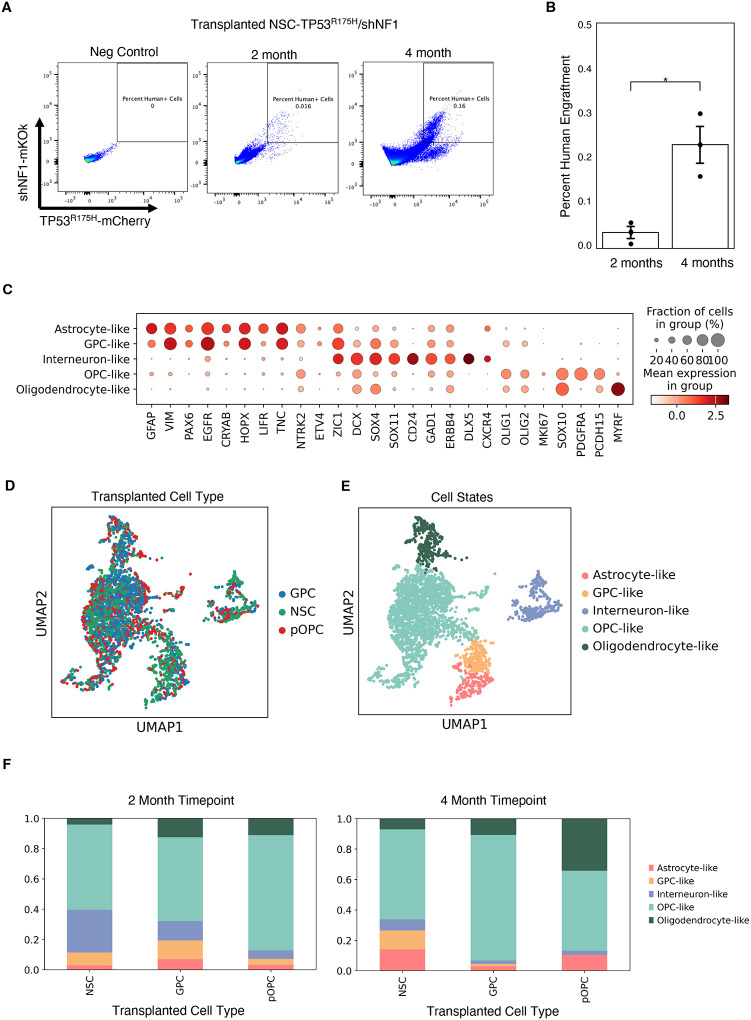
Figure 3: Single cell RNA sequencing analysis of transformed NSPCs.
a. FACS plots of mice after 2 and 4 months of transplantation, with an uninjected mouse for comparison
b. Quantification of human cells collected from NSPC conditions between 2 month and 4 month timepoints
c. Dot plot of distinguishing markers used to identify xenografted cell identity
d. UMAP plot of xenografted NSPCs annotated by NSPC identity
e. UMAP plot of xenografted NSPCs annotated by expression-based cell identity
d. Stacked bar graph showing percentages of cell type composition in each injected NSPC condition at the 2 month takedown (left) and 4 month takedown (right).

