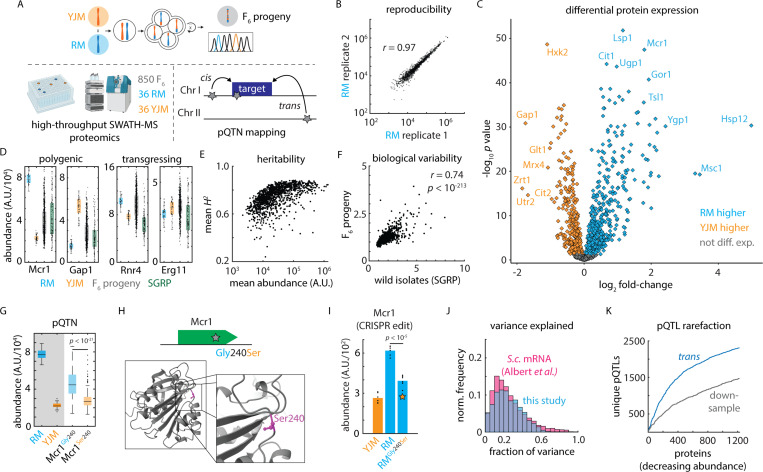
Figure 1. A variant-resolution genome-to-proteome map.
(A) Schematic of the mass spectrometry-based proteomics and genetic mapping approach. (B) Representative reproducibility across biological replicates of the vineyard (RM) isolate; Pearson’s r as indicated. (C) Volcano plot illustrating log2 fold-change in protein abundance (abscissa) and Benjamini-Hochberg-corrected t test p value (ordinate) between the vineyard (RM) and clinical (YJM) parents. n = 36 – 39. (D) Estimated abundance of Mcr1 and Gap1 (polygenic) and Rnr4 and Erg11 (transgressing) in RM parent (blue), YJM parent (orange), F6 progeny (grey), and SGRP wild strains (green). Boxes show median and upper and lower quartiles; whiskers show 1.5 times the interquartile range. (E) Mean broad-sense heritability of protein abundance (ordinate) as a function of estimated absolute protein abundance (abscissa) for all proteins measured in at least 80% of samples. (F) Normalized C.V. amongst the SGRP wild strains as compared to the mean C.V. in the parental isolates (ordinate) as a function of normalized C.V. amongst F6 progeny (abscissa). Pearson’s r as indicated. p value by t statistic. (G) Genetic mapping of a cis-acting SNP controlling the abundance of Mcr1. (H) Schematic and predicted AlphaFold2 protein structure of a cis-acting missense variant in Mcr1. (I) CRISPR reconstruction and mass spectrometry to validate the effect of the Mcr1Gly240Ser variant. n = 6; p value by two-sided t test. (J) Histogram of the fraction of total variance explained by the global (cis- and trans-acting) model in this study (blue) and in a highly powered eQTL mapping study in budding yeast (pink) 12. (K) Rarefaction plot of unique trans-acting pQTL associations (blue) discovered, ordered by decreasing estimated protein abundance. Also shown in grey is the same statistic for downsampled real data using only 50% of the F6 progeny. See also Figure S1.

