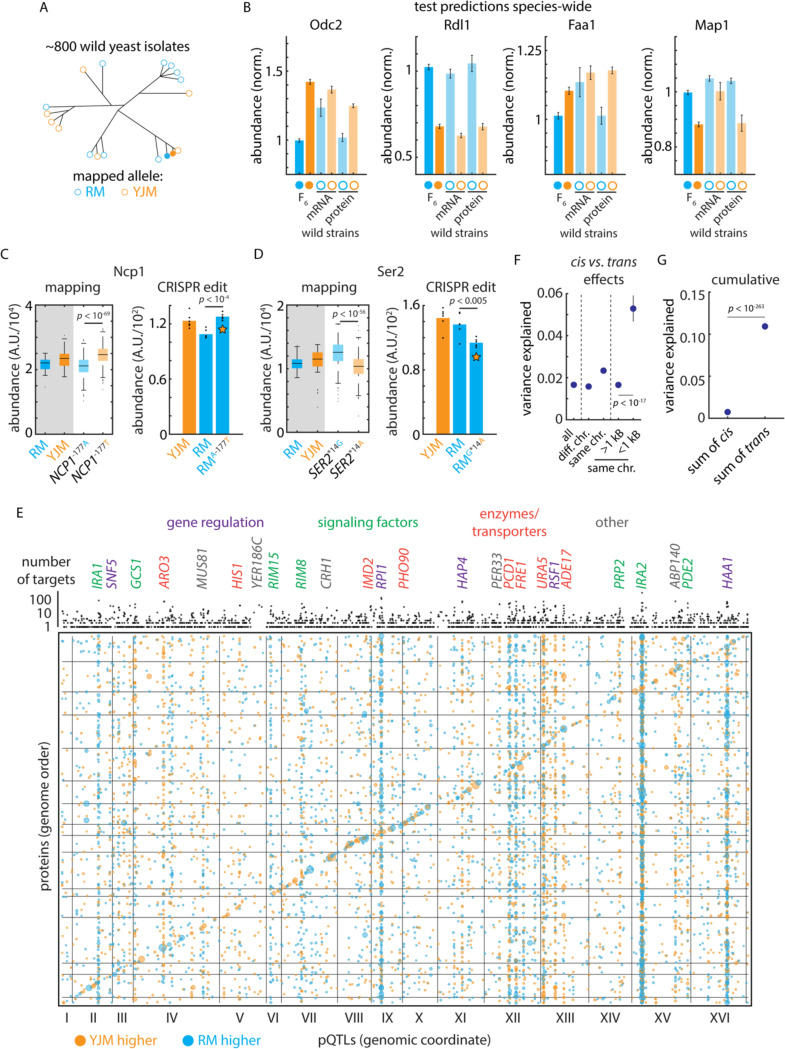
Figure 2. Mutation-to-molecule atlas reveals protein-level regulation.
(A) Schematic of statistical replication strategy. (B) Left: Genetic mapping of cis-acting effects on Odc2 and Rdl1 protein abundance and replication of this signal in the orthogonal 1,002 Yeast Genomes transcriptomes and proteomes. Right: As left, but for Faa1 and Map1; these signals were evident only at the proteomic level in the replication data. Data shown are median and s.e.m. (C) Left: Genetic mapping of cis-acting effect on Ncp1 protein abundance. Right: CRISPR reconstruction and mass spectrometry to test the effect of the NCP1A-177T variant. n = 6; p value by two-sided t test. (D) As in (C), but for the SER2G*14A variant. (E) Bubble plot indicating the genomic position of all pQTLs. pQTL positions and encoding genes are arranged in genome order. Orange dots indicate clinical (YJM) allele increases protein level; blue indicates vineyard (RM) allele increases level. Dots are sized by genetic mapping p value. Indicated above is the number of target proteins controlled by each locus (aggregated by gene); highlighted are trans hotspots color-coded by gene function as indicated. (F) Variance explained by pQTLs with the indicated distance to the encoding gene for the target protein; p values by Student’s t test. Dots indicate mean and bars standard error. (G) Cumulative effect of cis- and trans-acting pQTLs across all proteins. Dots indicate mean and bars standard error; p value by Student’s t test. See also Figure S2.

