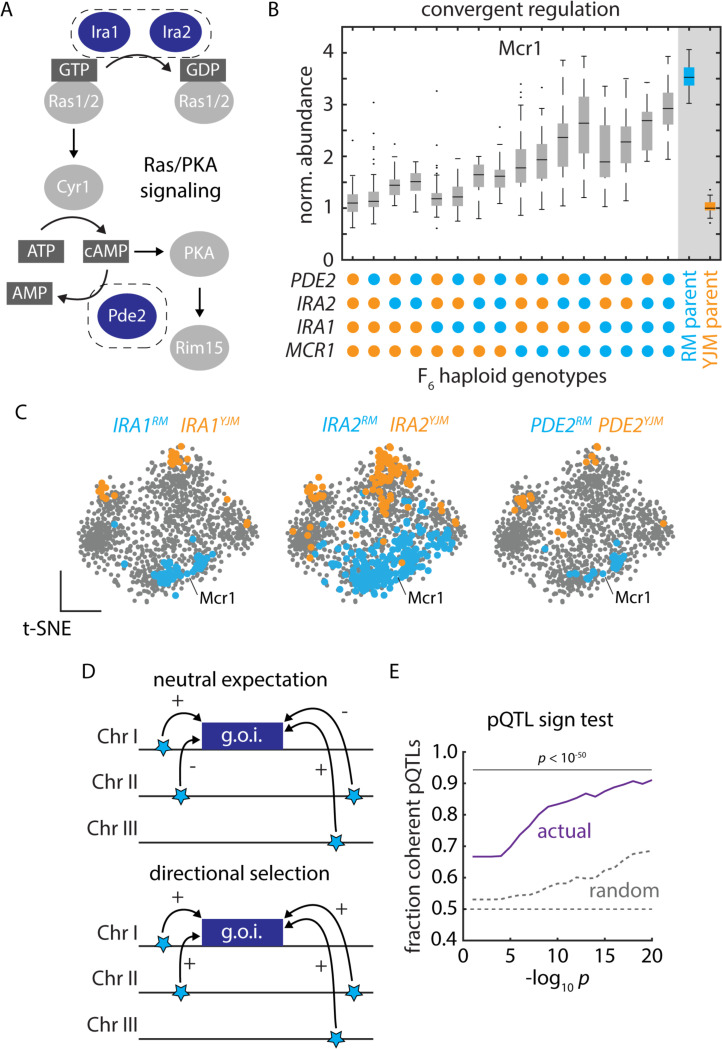
Figure 3. Polygenic adaptation reflecting natural selection on protein abundance.
(A) Schematic of Ras/PKA signaling highlighting the Ira1, Ira2, and Pde2 proteins which harbored trans-acting hotspots. (B) Mcr1 protein levels as a function of F6 progeny genotypes at the PDE2, IRA2, IRA1, and MCR1 loci, as indicated. Boxes show median and upper and lower quartiles; whiskers show 1.5 times the interquartile range. (C) tSNE embeddings highlighting proteins upregulated by the vineyard (blue) and clinical (orange) alleles of IRA1, IRA2, and PDE2, as indicated. (D) Schematic illustrating the principle of the pQTL sign test. (E) Mean fraction of coherent trans-pQTLs across all mapped associations (ordinate) as a function of trans-pQTL p values (abscissa). Actual mapping data is shown in purple; random expectation across all trans-pQTLs, regardless of protein target, is shown in grey; p values by binomial test. See also Figure S3.

