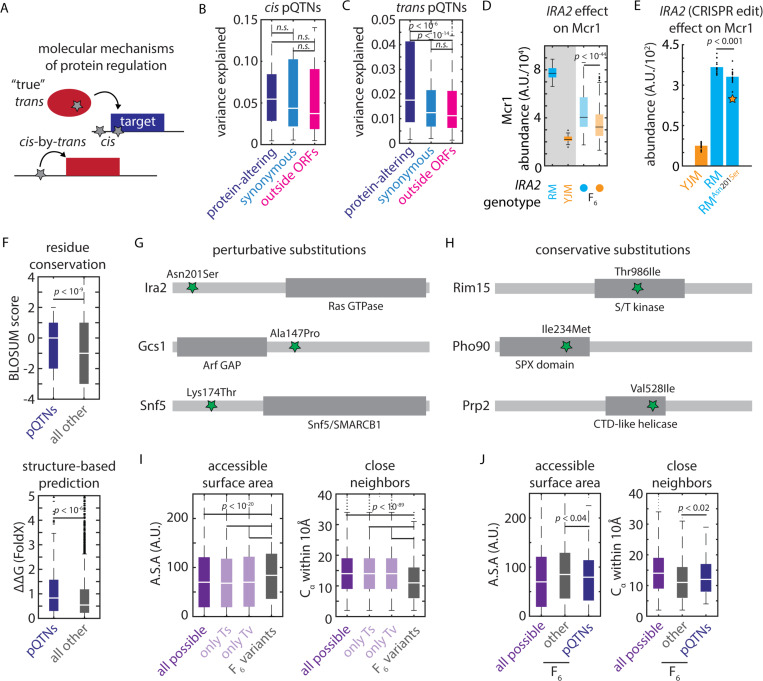
Figure 4. Biochemical constraints revealed by proteomic mapping.
(A) Schematic illustrating possible molecular mechanisms of cis and trans regulation (B) Effect size of protein-altering, synonymous, and regulatory cis-pQTNs, as indicated. Boxes show median and upper and lower quartiles; whiskers show 1.5 times the interquartile range. (C) Effect size of protein-altering, synonymous, and regulatory trans-pQTNs, as indicated. Boxes show median and upper and lower quartiles; whiskers show 1.5 times the interquartile range. p values by two-sided t test. (D) Predicted effect from genetic mapping of the IRA2Asn201Ser missense variant on Mcr1 levels. p value by F test. (E) CRISPR reconstruction and mass spectrometry to validate the effect of the IRA2Asn201Ser variant on Mcr1 levels. n = 15; p value by two-sided t test. (F) BLOSUM62 (top) and FoldX scores (bottom) for missense trans-pQTNs (blue) as compared to all other segregating missense variants (grey). Boxes show median and upper and lower quartiles; whiskers show 1.5 times the interquartile range. p values by Mann-Whitney U test. (G) Illustrative conservative pQTN substitutions and (H) perturbative pQTN substitutions with functional domains of the mutated proteins indicated. (I) Solvent-accessible surface area and number of Cα within 10Å for all possible missense SNPs (purple; also shown are subsets resulting from transitions and transversions) and all missense variants segregating in the F6 mapping panel (grey). (J) As in (I) for all possible missense SNPs (purple), missense pQTNs identified in this study (blue), and all other missense variants segregating in the F6 mapping panel (grey). p values by Mann-Whitney U test. See also Figure S4.

