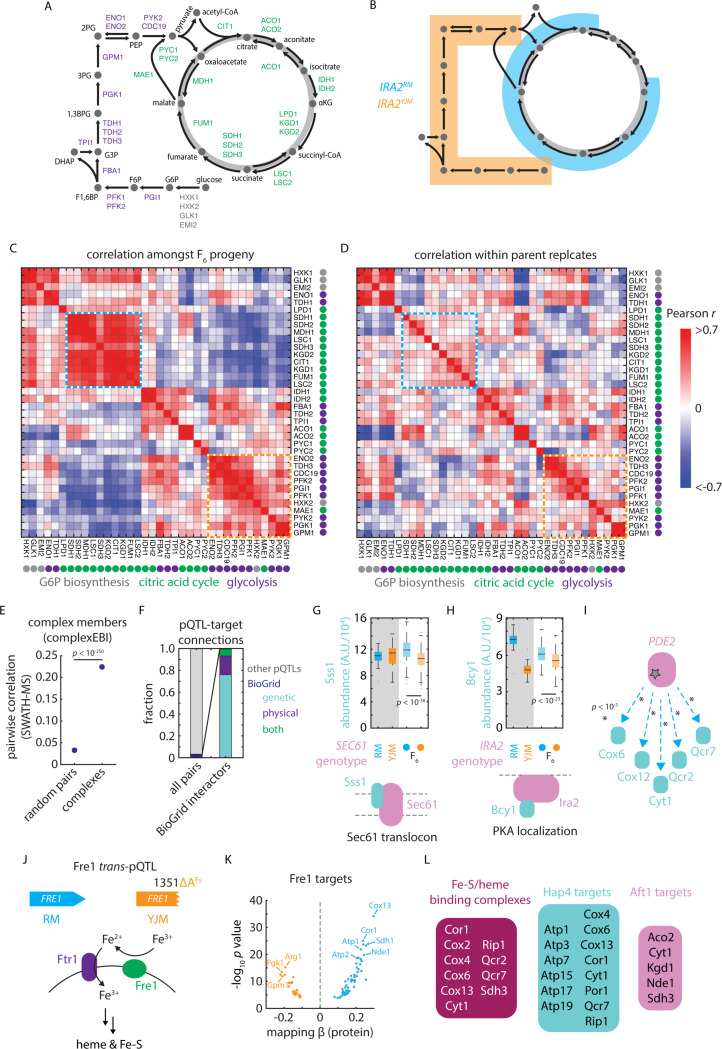
Figure 5. pQTLs reveal molecular and functional connectivity.
(A) Schematic of metabolites and enzymes of glycolysis (purple) and citric acid cycle (green). (B) As in (A), with metabolites highlighted in blue and orange if an enzyme catalyzing a reaction involving that metabolite is regulated by IRA2RM or IRA2YJM alleles, respectively. (C) Heatmap of pairwise SWATH-MS abundance correlations amongst enzymes shown in (A). Highlighted in blue and orange are blocks of coregulated enzymes regulated by the IRA2RM or IRA2YJM alleles, respectively. (D) As in (C), but for correlations within replicate measurements of parental isolates. (E) Pairwise SWATH-MS abundance correlations between complex members as compared to all possible pairs of measured proteins. p value by Mann-Whitney U test. Dots indicate mean and bars standard error. (F) Cumulative frequencies of pQTL-target connections reflecting (left) BioGRID interactions (blue) and all other pQTL-target pairs (grey) and (right), amongst BioGRID interactions, those annotated as genetic (blue), physical (purple) or both genetic and physical (green). (G) Sss1 abundance in vineyard and clinical parents and in F6 progeny with SEC61 genotypes as indicated. (H) Bcy1 abundance in vineyard and clinical parents and in F6 progeny with IRA2 genotypes as indicated. (I) Schematic of pQTL-target connections between PDE2 and various targets upregulated by vineyard allele, as indicated. p values by F test. (J) Schematic of the role of Fre1 in iron reduction and uptake at the plasma membrane 67. (K) Volcano plot illustrating predicted effects on abundance from genetic mapping (abscissa) and forward selection F test p value (ordinate) for the FRE1 trans-pQTL. (L) Downstream FRE1 pQTL targets that bind iron or heme or that are targets of Hap4 or Aft1, as indicated. See also Figure S5.

