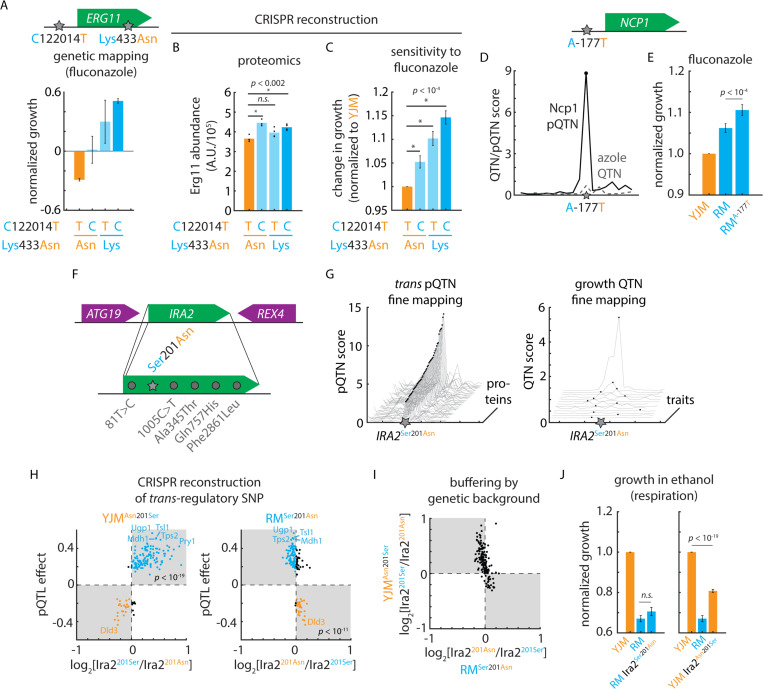
Figure 6. Cryptic fitness effects embedded in the mutation-to-protein map.
(A) Genetic mapping of the phenotypic effects of ERG11T1220124C and Erg11Asn433Lys in fluconazole. Shown is normalized growth of F6 progeny with genotypes as indicated. (B) Mass spectrometry of Erg11 protein levels in clinical (YJM) wild-type and CRISPR-edited YJM ERG11T1220124C, YJM Erg11Asn433Lys, and YJM ERG11T1220124C Erg11Asn433Lys mutant strains. n = 4; p values by Student’s t test. (C) Growth of clinical (YJM) wild-type and CRISPR-edited YJM ERG11T1220124C, YJM Erg11Asn433Lys, and YJM ERG11T1220124C Erg11Asn433Lys mutant strains in fluconazole. n = 96; p values by Student’s t test. (D) Fine-mapping of Ncp1 cis-pQTN as compared to fine-mapping of the azole-sensitivity QTL in the vicinity of NCP1. (E) Growth of clinical (YJM), vineyard (RM), and CRISPR-edited RM NCP1A-177T mutant strains in fluconazole. n = 96; p value by Student’s t test. (F) Diagram of IRA2 locus and segregating IRA2 mutations. (G) pQTN fine-mapping scores for the top 50 IRA2-target associations (left) and QTN fine-mapping scores for IRA2 growth QTL associations. (H) Predicted IRA2 pQTN effects from genetic mapping (this study; ordinate) as compared to measured effects of (left) CRISPR-edited YJM Ira2Asn210Ser and (right) RM Ira2Ser201Asn mutants. Mass spectrometry estimated abundances normalized to wild type in each case. (I) Measured effects of CRISPR-edited YJM Ira2Asn210Ser (ordinate) and RM Ira2Ser201Asn (abscissa) mutants. (J) Growth of clinical (YJM), vineyard (RM), and CRISPR-edited RM Ira2Ser201Asn mutant (left) and YJM Ira2Asn210Ser mutant (right) in ethanol. n = 96; p values by Student’s t test. See also Figure S6.

