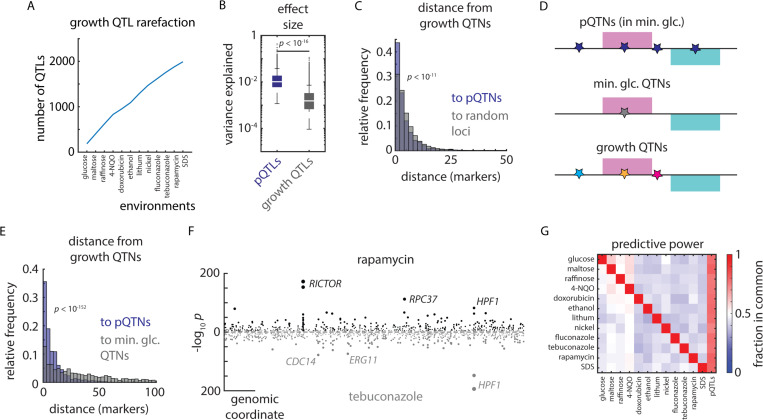
Figure 7. Proteomes identify causal variants underlying quantitative traits.
(A) Rarefaction plot of unique growth QTLs discovered as a function of additional environments mapped, as indicated. (B) Effect size (variance explained) of pQTLs (blue) and growth QTLs (grey). p value by Mann-Whitney U test. (C) Relative frequency histogram of the distance from al phenotypic QTNs to (blue) the nearest pQTN and (grey) randomly selected sets of markers of the same size. p value by Kolmogorov–Smirnov test between real and permuted data. (D) Schematic of pQTNs (blue), growth QTNs in minimal glucose medium (no stress; grey), and stress-responsive growth QTNs (various colors). (E) As in (C), but illustrating the distance from stress-responsive growth QTNs to (blue) the nearest pQTN and (grey) growth QTNs discovered in minimal glucose (no stress). p value by Kolmogorov–Smirnov test. (F) Example Miami plot of QTLs identified for growth in rapamycin (top) and tebuconazole (bottom). (G) Heatmap of the relative fraction of QTLs in common between environments (ordinate) and environments and pQTLs (abscissa), as indicated. See also Figure S7.

