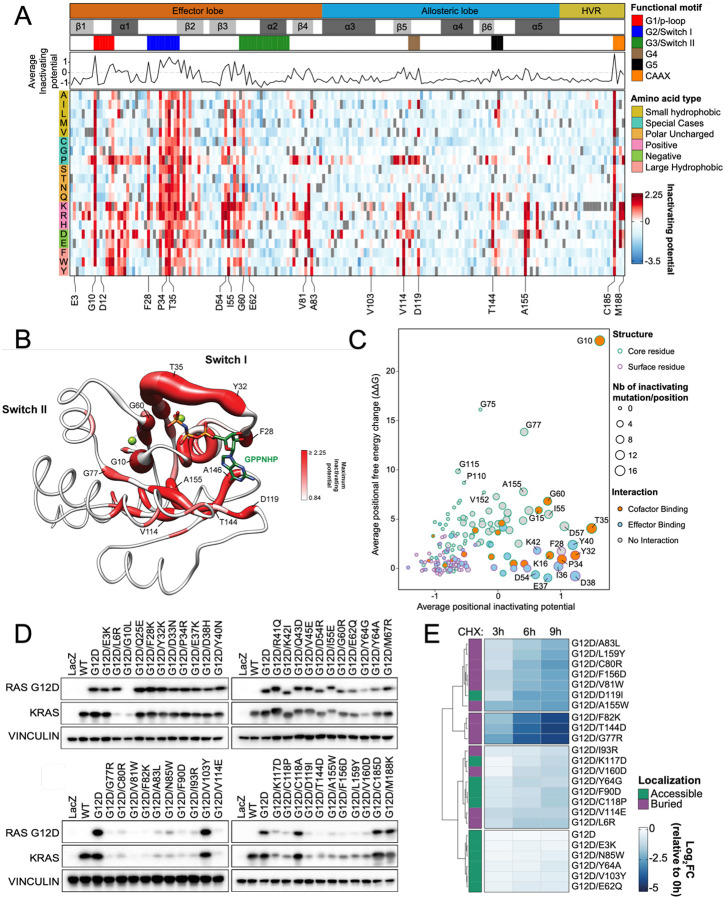
Figure 2. Loss-of-function KRASG12D screen reveals second-site suppressor mutations and destabilizing mutations.
(A) Heat map representation of LFC allele enrichment (red) and depletion (blue) showing LFCs for each allele from deep mutational scanning (DMS) screen anchored on KRASG12D mutant background. The LFC for each variant was calculated based on the Log2 fold change of normalized counts on day 12 compared to Day 0 for HCC827 cells. Each column represents an amino acid in KRAS, and each row represents the substituted residue, and grey squares indicate missing alleles. Secondary structures, the five nucleotide-binding motifs (G1-G5), and two Switch motifs are annotated on top, followed by a line graph showing the average LFC of all substitutions per position. (B) Mapping of maximal LFC on the crystal structure of KRAS per residue position. The color indicated the highest LFC of substitutions at each amino acid and the size correlates with the number of high-ranking putative suppressor mutations at each residue. (C) Scatter plot showing position-level calculated, mean free-energy change upon mutation (intrinsic KRASG12D stability) and corresponding average scaled LFC for fitness in the KRAS DMS screen, with higher ΔΔG values corresponding to greater instability and positive DMS LFC indicating inactivating second-site mutation. (D) Transient expression of indicated KRASG12D suppressor mutant alleles in 293T cells. Both RASG12D and total KRAS were detected. (E) Heatmap of Log2FC of RASG12D levels at indicated timepoints compared to 0 hour following cycloheximide (CHX) treatment in HA1E isogenic cells expressing indicated KRASG12D mutants.

