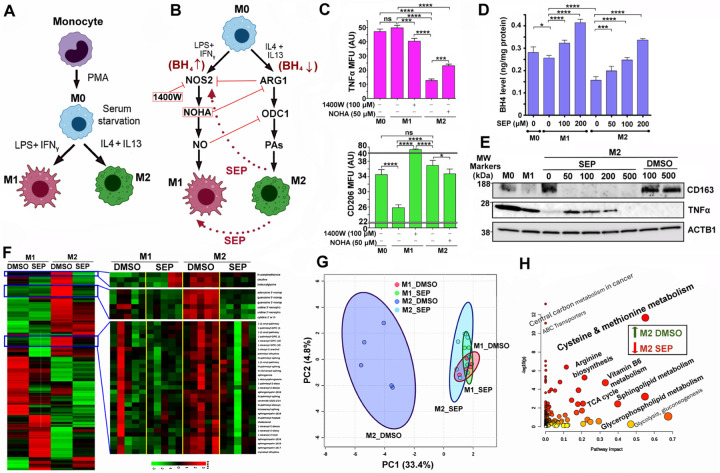
Figure 2. Redirecting arginine metabolism reprograms tumor-associated macrophages (TAMs).
A. Scheme for differentiation of monocytes into naïve (M0) macrophages and subsequent M1 vs. M2 polarization in vitro. B. Discrete arginine metabolic pathways in M1 vs. M2 macrophages and their antagonistic relationships. Scheme for phenotypic conversions between M1 and M2 macrophages by inhibiting NOS2 in M1 (M1→M2 conversion) vs. ARG1 in M2 (M2→M1 conversion) or providing SEP to M2 (M2→M1 conversion) (18,19). C. (Top) M1 marker TNFα levels in different subsets of macrophages (M0, M1, or M2) treated with an NOS2 inhibitor 1400W or ARG1 inhibitor NOHA. MFU: Mean fluorescence unit. (Bottom) M2 marker CD206 levels in macrophage subsets treated with 1400W or NOHA. Note that 1400W treatment of M1 cells reduced TNFα levels, but increased CD206 levels. Conversely, NOHA treatment of M2 cells elevated TNFα levels, but decreased CD206 levels. D. Reduced BH4 levels in M2 macrophages, compared to M0 and M1 macrophages, and dose-dependent normalization of the levels after SEP (50, 100, or 200 µM) treatment for 3 days. E. Treatment of M2 macrophages with SEP (50, 100, or 200 µM) lowered M2 marker (CD163) levels, while elevating M1 marker (TNFα) levels. Note that the decrease of TNFα levels in M2 cells treated with the extremely high (500 µM) SEP was presumably due to reduced viability of cells. F. (Left) Heatmap of metabolite levels in M1 vs. M2 macrophages treated with control DMSO vs. SEP (n=5). (Right) Metabolites normalized in M2 macrophages after SEP treatment. G. PCA of metabolites normalized in SEP-treated M2 macrophages. Note the co-localization of SEP-treated M2 with M1 (DMSO or SEP-treated) macrophages and segregation of DMSO-treated M2. H. Pathway analysis of metabolites normalized (downmodulated) in SEP-treated M2 macrophages. Note the significant involvements of these metabolites in energy production, including TCA cycle, lipid and amino acid metabolism.

