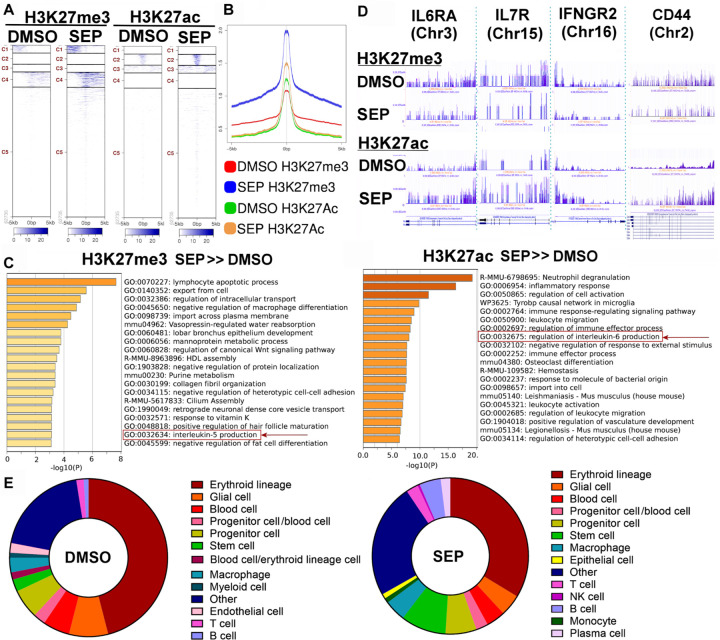
Figure 5. CUT & Tag analysis of bone marrow of SEP-treated MMTV-neu mice reveals increased levels of total T cells.
A-B The heatmaps (A) and peak sizes (B) of H3K27me3 (suppression) and H3K27ac (activation) histone marks of the bone marrows of DMSO with tumor vs. SEP without tumor groups of MMTV-neu mice. Note that both histone marks were higher in the latter than the former groups. C. Pathways of genes with elevated H3K27me3 mark (more strongly suppressed, left) vs. pathways of genes with elevated H3K27ac mark (more strongly activated, right) in SEP without tumor group compared to DMSO with tumor group. Note that SEP-suppressed pathways belonged to those involved in immune suppression (e.g., IL5 production), whereas SEP-activated pathways belonged to those involved in pro-inflammatory responses (e.g., IL-6 production). D. H3K27me3 and H3K27ac marks of select SEP-activated genes involved in T cell activation or memory T cell formation (IL6RA, IL7R, IFNGR2, and CD44 (83–86). E. Bone marrow cell compositions determined based on epigenomic profiles (predicted by Cellkb). Note the significant increase in T cell, NK cell and stem cells in the bone marrow of SEP-treated animals.

