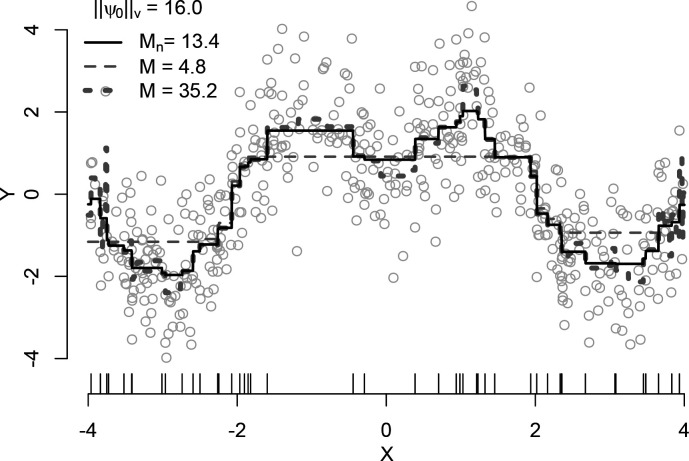
Figure 1:
HAL in the univariate setting. Benkeser and van der Laan [2016] conducted a simulation, drawing 500 independent copies of from a distribution and 500 copies of from a distribution where so that . The HAL basis functions included indicators at observed data points for and selected the bound on the variation norm via ten-fold cross-validation from 100 possible bounds from 0 to 350.

