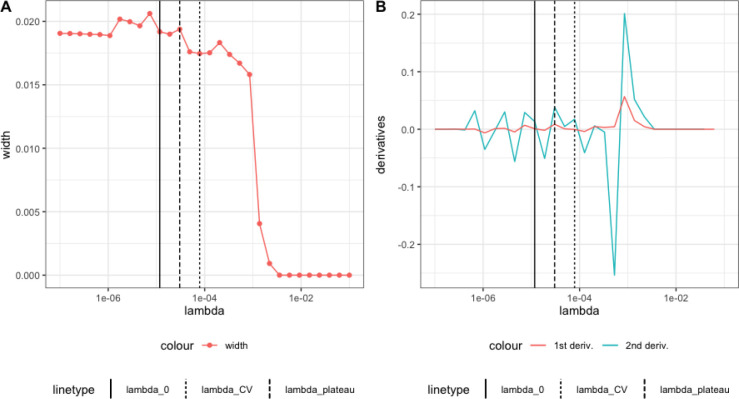
Figure 2:
A. Simulation of Wald interval as a function of . B. First-order and second-order derivatives of the curve. The solid line represents , the fine dotted line represents , and the thick dotted line represents . (Reproduced figure Cai and van der Laan [2020]).

