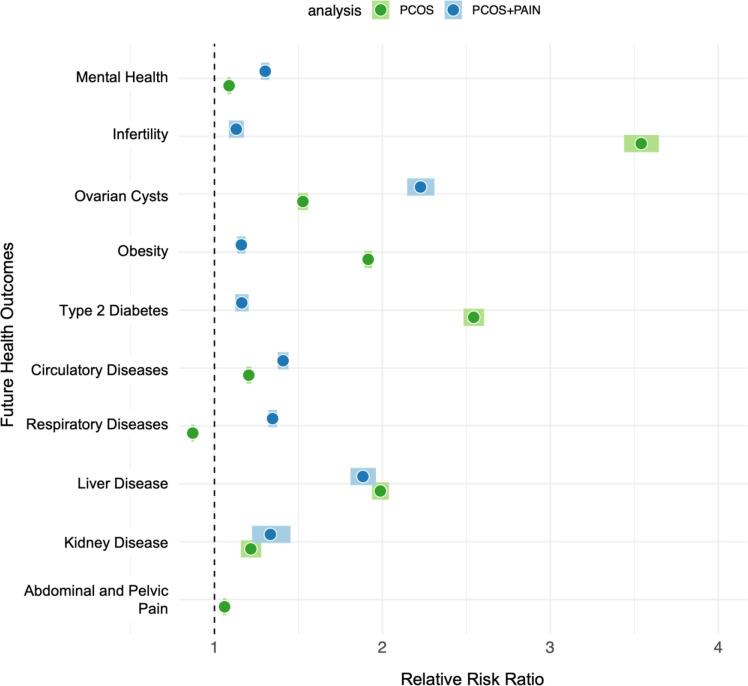
Figure 3. Relative risk ratios for future health outcomes associated with PCOS and Pain.
Relative risk ratios (RR) (x-axis) for future health outcomes (y-axis) for both PCOS (green) and PCOS and Pain (blue) cohorts. Darker hued circles indicate RR, while lighter hued boxes indicate the 95% confidence intervals. The black dashed line is set 1 and is the threshold for RR, where > 1 is increased RR and < 1 is decreased RR.

