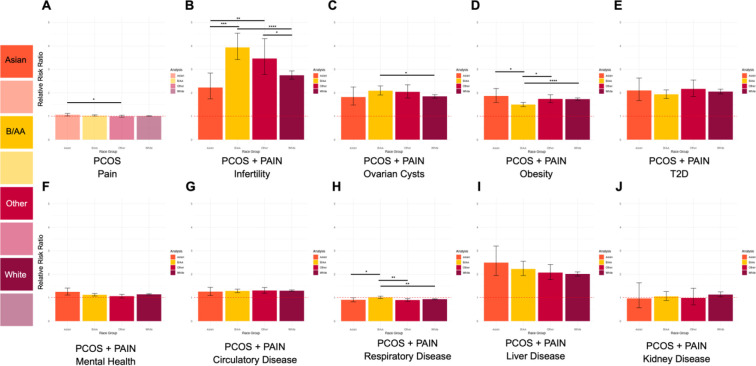
Figure 4. Parts A-J. Self-reported race-stratified relative risk ratios for future health outcomes.
Relative risk ratios (RR) for future health outcomes (y-axis) stratified by self-reported race. Colors represent different self-reported race groups (x-axis): Asian (orange), Black or African American (yellow), Other (red), White (purple). A. Light hues indicate RR calculation for entire PCOS cohort. B-J. Dark hues indicate RR calculation for PCOS and Pain cohorts. Error bars represent the 95% confidence intervals. Significant differences between RR are represented by asterisks (*), where p-value ≤ 0.05 = *, p-value ≤ 0.005 = **, p-value ≤ 0.0005 = ***, and p-value ≤ 0.00005 = ****. Red dashed lines is set 1 and is the threshold for RR, where > 1 is increased RR and < 1 is decreased RR.

