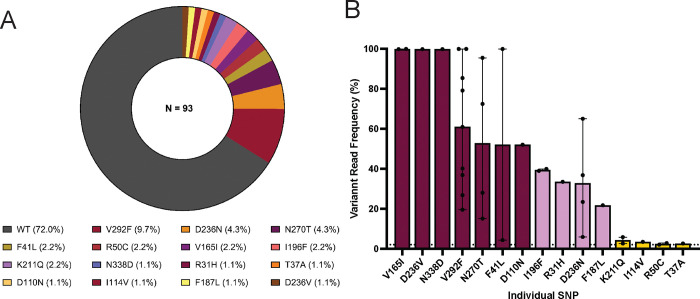
Figure 1. Population prevalence of PfCyRPA SNPs.
(A) The prevalence of PfCyRPA-associated SNPs was calculated as the percentage of SNPs detected within the total number of clinical samples in the population (N=93) using a variant allele frequency (VAF) threshold of 2%. PfCyRPA sequencing was performed from pfcyrpa amplicons using the Illumina NovaSeq 6000 sequencing platform and variant analysis was performed using the Geneious Prime software version 23.1.1. The graphs were plotted using the GraphPad Prism version 1.0.2 software. (B) Variant read frequency of PfCyRPA SNPs. Variant read frequency was determined from the sequencing data outputs and calculated as the percentage of the variant reads relative to the coverage at the variant position. The data are presented as bar graphs showing the number of isolates (black dots) with the error bars presenting the minimum and the maximum frequencies for each SNP in complex clinical samples. The SNPs are categorized as low <20% (golden), intermediate 2–25% (lavender) or high frequency SNPs >25% (maroon), based on their respective frequency within the individual complex sample. The dotted line depicts the 2% VAF threshold. The graphs were plotted using the GraphPad Prism version 1.0.2 software.

